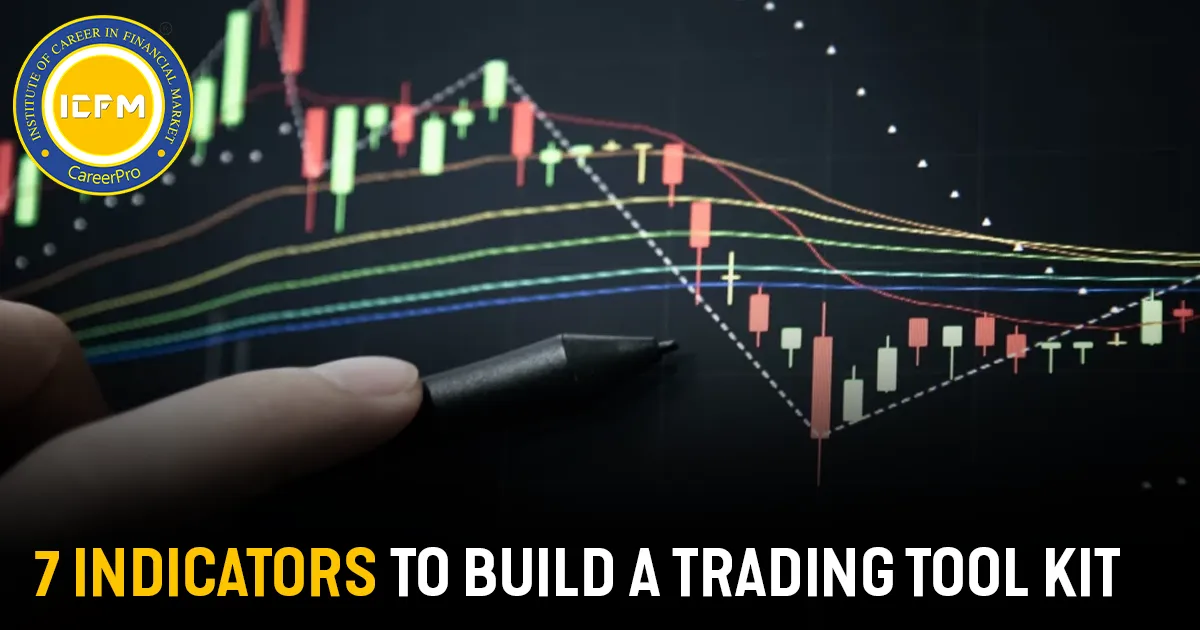
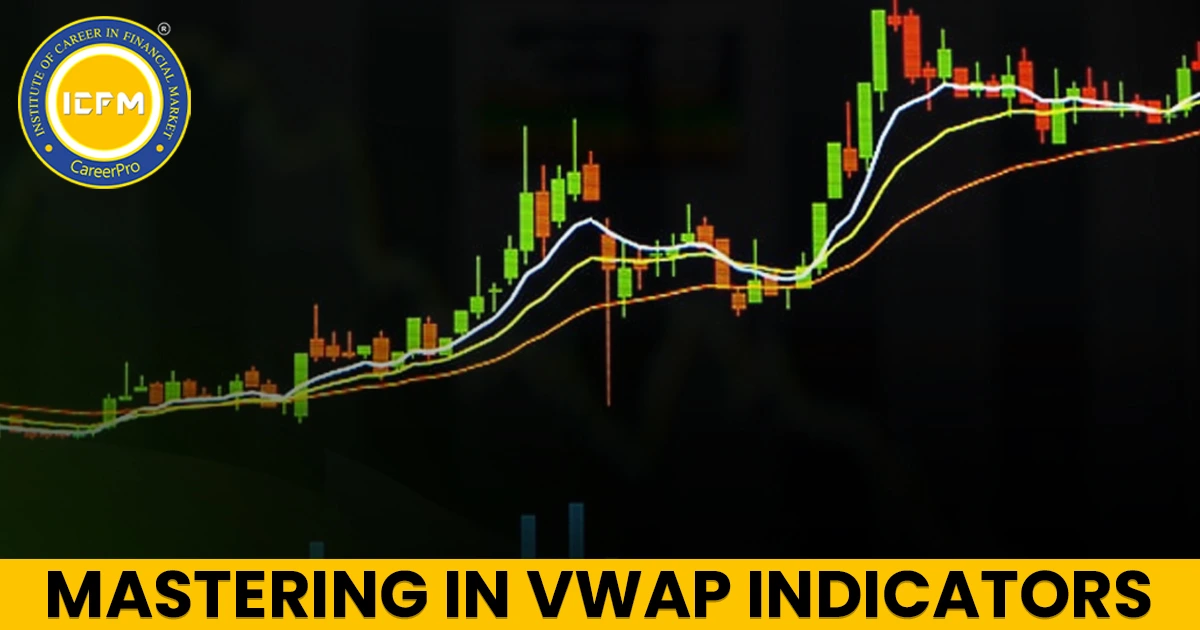
You may have heard the term "technical indicators" thrown around. But what exactly are they, and how might they help you make smarter trading decisions? Simply put, technical indicators are tools that help traders analyze market trends and make predictions based on past price movements. They're like signals guiding you on when to buy, sell, or stay out of a market.
7 basic technical indicators that you can include in your trading kit here in this blog.
1-Moving Averages (MA):
Moving averages reduce noise by producing an ever-changing average price of any time frame. Moving averages indicate a trend's direction by smoothing out price fluctuations in a short time frame.
● Simple Moving Average (SMA): It is the average price of a defined period (e.g., 50 days). It's easy to calculate and, therefore, the most common type of moving average.
● Exponential Moving Average (EMA): Like SMA, it places more weight on current prices and is more sensitive to changes.
Why use it? When you use moving averages, you can identify trends. If the price exceeds the moving average, an uptrend may be underway. If lower, maybe it's a downward trend.
2-Bollinger Bands:
Bollinger Bands consists of three lines: the middle line is a simple moving average, and the upper and lower bands are standard deviations of price movements. The bands expand and contract based on market volatility.
● When the price moves near the upper band, the market might be overbought.
● When the price approaches the lower band, it might be oversold.
Why apply it? Bollinger Bands indicate when the price has touched the bands, perhaps during high or low volatility conditions and potential price reversal. If the price moves above or below the bands, it probably makes a big move in either direction.
3-Volume:
Volume refers to the total number of shares or contracts transacted for a security or market within a specific timeframe. Volume is really essential because it confirms price movements.
● If the price increases with increasing volume, the trend may be strong.
● If the price moves up but volume is low, the trend could be weak and might reverse.
Why use it? The volume shows how strong a price move is. High volume can confirm trends, while low volume could signal a potential reversal.
4-Relative Strength Index (RSI):
The RSI is a momentum oscillator that calculates the speed and change of price movements. It works to identify overbought or oversold market conditions, which could signal a reversal.
● The RSI range is from 0 to 100.
● An RSI above 70 indicates the asset may be overbought (possible sell signal).
● An RSI below 30 indicates the asset may be oversold (possible buy signal).
Why use it? RSI helps you avoid buying when the market is too hot or selling when it's too cold. It shows whether a market might be due for a correction.
5-Moving Average Convergence Divergence (MACD):
The MACD is a trend-following momentum indicator that shows the relationship between two moving averages of an asset's price. It consists of the MACD line, signal line, and histogram.
● When the MACD line crosses above the signal line, it's considered a bullish signal (potential buy).
● When the MACD line crosses below the signal line, it's considered a bearish signal (potential sell).
Why use it? MACD helps determine the strength of a trend and possible trend reversals. This makes it a helpful tool for traders entering or exiting trades.
6-Fibonacci Retracement:
It is one of the tools for identifying the possible support and resistance areas with key Fibonacci ratios that most traders use: 23.6%, 38.2%, 50%, 61.8%, and 100%. They draw the levels between a price move's high and low, helping them discover potential reversal points.
The most critical levels to observe in the tool are as follows:
● The principal Fibonacci levels 23.6%, 38.2%, 50%, 61.8%, and 100%.
● Prices tend to return and retrace a prior move's section in the same direction.
Why use it? The Fibonacci Retracement technique guides you toward knowing where the price may pause or reverse following a strong trend. These levels are widely followed by traders making them essential when entering and exiting a trade position.
7-Average True Range (ATR):
ATR measures the average range between an asset's highest and lowest price over a certain period. It does not show the direction but the extent to which an asset's price moves in a given time frame.
●A rising ATR means higher volatility.
●A falling ATR means lower volatility.
Why Use It? ATR is useful for understanding market volatility. Traders use it for setting stop-loss orders and understanding how much risk to take on a trade.
Putting it All Together:-
As you can see, each of the above technical indicators has strengths and weaknesses. Therefore, do not rely on just one. Combining several indicators will give you a clearer picture of market conditions.
For example, you use moving averages to identify trends, RSI or Stochastic Oscillator to pinpoint the overbought and oversold conditions, and Volume to confirm trend strength.
Understanding and using these tools, a better basis would result in information-driven decisions. You may have heard the term "technical indicators" thrown around. But what exactly are they, and how might they help you make smarter trading decisions? Technical indicators help traders analyze market trends and predict past price movements. They're like signals guiding you on when to buy, sell, or stay out of a market.


