RSI INDICATOR
The Relative Strength Index, a momentum oscillator by technical analysis, figures out the speed and change of price movements. RSI helps those traders in knowing the overbought or oversold conditions in a market, thereby guiding its buying and selling decisions.
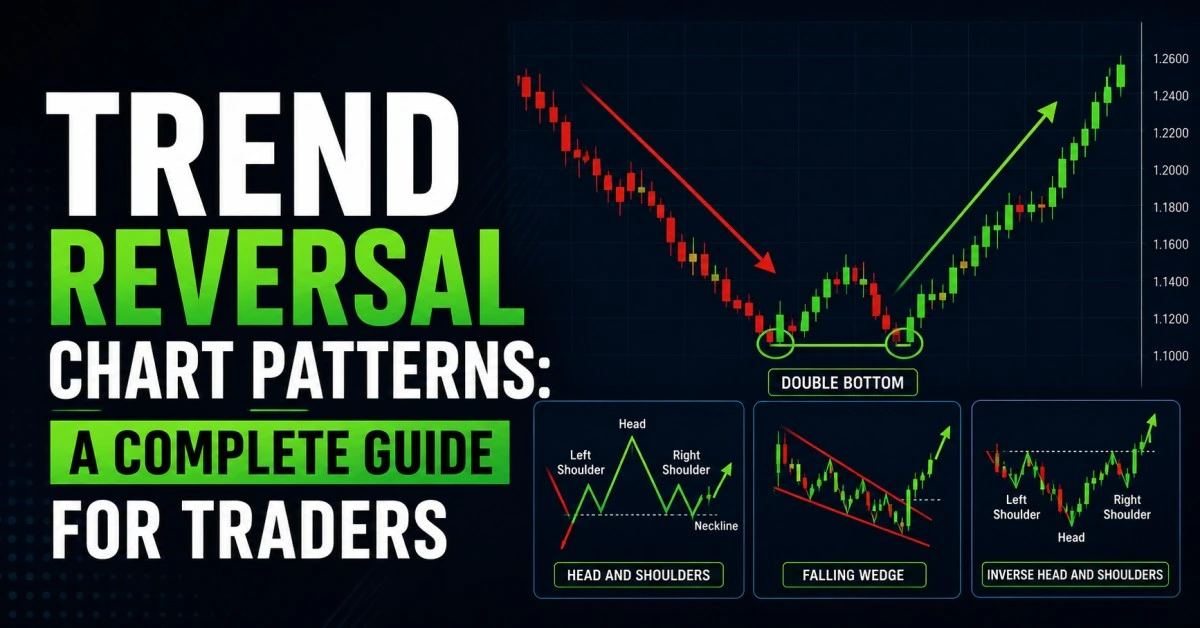
Interpreting the RSI:
- Overbought Conditions - Generally speaking, an RSI above 70 raises the alarm that a security may have ran too high and therefore requires some price correction.
- Oversold Conditions - On the other hand, when the RSI falls below 30, an alert is triggered that a security might be over-sold and may experience a price increase.
- Divergence: If the price of a security establishes a new high or low but the RSI does not, it could be a signal to reverse.
For example, if the price made a new high yet the RSI did not then that would be divergence to weaken the momentum.
Practical Applications of the RSI:
- Using RSIs to time entry and exit: A trader may use RSI to time entry and exit. For instance, on a buy signal when RSI crosses over the 30 levels and sell on a signal when RSI drops below the 70 level.
- Trend Confirmation: The RSI can be applied to confirm the strength of a trend. In an uptrend, when the RSI was found above 50 for most of the period, it was seen as a case of strong momentum, whereas in a downtrend when the RSI had consistently dropped below 50, that signalled further weakness.
- Setting Alerts: Most trade platforms allow users to set alerts whenever the RSI crosses such thresholds, say 30 or 70, which will alert a trader if there are potential conditions in the market.
Disadvantages of RSI:
- False Signals- Just like every indicator, the RSI is also prone to giving false signals, especially when markets are strongly trending and often prices remain overbought or oversold for durations
- Context matters: RSI may change its effectiveness according to the market or period one is trading with. It is generally used practically with other trend indicators or analytical techniques.
- Lagging Indicator: RSI uses past price data; thus, in highly dynamic market conditions, it lags sometimes. To increase the reliability of the trading signals even further, one may use the RSI as a combination with another technical indicator. For illustration, here are only some examples of the most popular combinations:
- Moving Averages: Combination with moving averages may help make more reliable the judgment to the existence of a certain trend. Thus, if price is rising and at the same time the RSI is growing, then the signal will be more valuable.
- Support and resistance levels: the RSI can be integrated with the identification of support and resistance levels so that a trader can predict when the price would change due to the conditions in the market.
Conclusion:
Relative Strength Index is a versatile tool that is widely used in technical analysis. In this tool, market momentum information may be derived, indicating potential reversal points. Through understanding its calculation, interpretation, and practical applications, a trader may make use of the RSI to well help bolster his trading strategy. However, as with any tool, the RSI can be used by correlating it with other indicators or a comprehensive trading plan, as this can make use of the effectiveness better while further reducing the risks involved.