Evening Star
The evening star is a reversal pattern which the bearish
kind falls at the summits of an ascending trend. It is three candles: a tall
white candle, a small-bodied candle that gaps up-the "star"-and a
black candle that closes well into the first candle's body. This pattern
suggests a drop in prices.
Description:
The Evening Star is a reversal pattern indicating buying
pressure to the selling pressure. Being in a strong uptrend, it has a long
white candle for the first day, and indecision is marked on the second day with
a very small range and the third day further confirms dominance by bears with a
black candle at least half way down in the first day's body.
Criteria:
- Clear
uptrend
- White
candle is the first one, but the second candle was small (that means
indecision).
- At least
halfway down the first, the third candle closes.
Signal Enhancements:
- The more
expanded the white and black candles, the stronger the reversals.
- More
significant indecision in the middle day increases the chances for a reversal.
- Gaps in
front of the star as well as behind it make it a stronger signal for this
pattern.
Pattern Psychology:
This pattern is indicative of the reverse change of mood in
the market as the buyers sell some of their positions and sellers dive to buy
most, indicating the reversal of the trend. It is called a Morning Star.
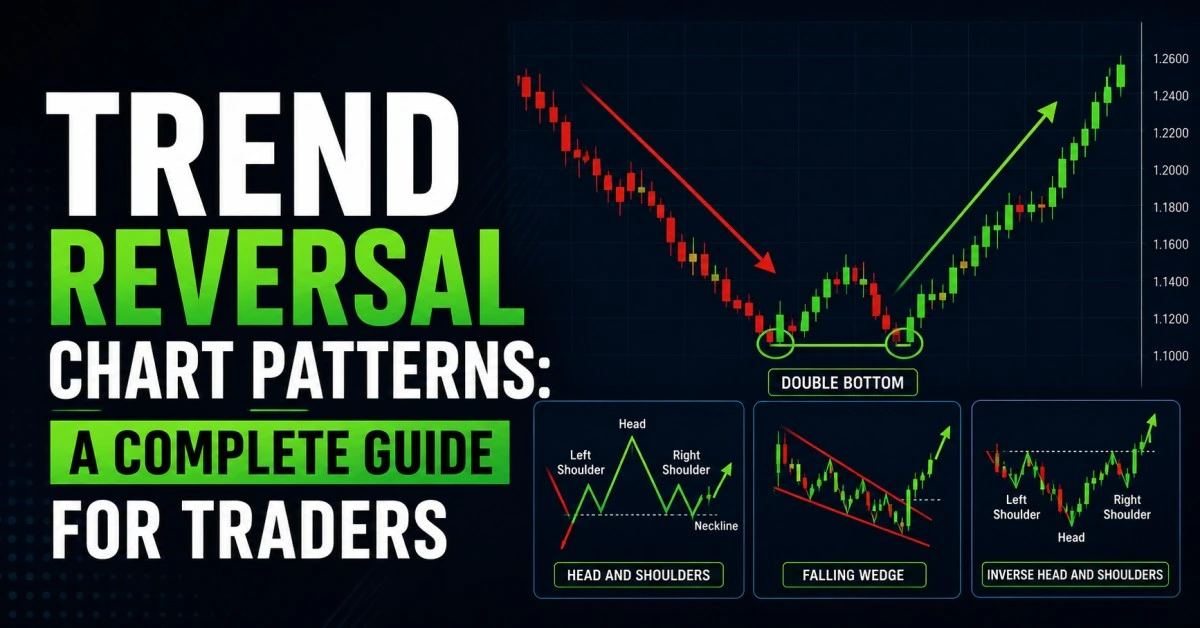
Morning Star
A tall black candle is contained in a series of a morning
star pattern that consists of a small-bodied candle that gaps down and closes
into the first candle's body. This pattern is a bullish reversal and will
confirm an indication of price increase in the near future.
Description:
The Morning Star pattern develops after a decline, and it
starts with the first day being an extended black candle. The second day is an
indecision day with a small-bodied trading range. The third day is a confirming
bullish reversal day that closes very significantly higher.
Selection Criteria:
- There is
a clear downtrend
- The first
candle is black. The second candle is an indecision day with a small-bodied
trading range. The third candle is white and closes at least halfway up the
black candle.
Signal Improvements:
- Larger
black and white candles indicate bigger reversals.
- The more
indecision on the star day, the higher the change for the reversal to take
place.
- Gaps
surrounding the star day make the pattern better.
Pattern Psychology:
The selling pressure decreases and is starting to spend by
the buyers, meaning that possibly the shift in the control towards the buyers
will be made.
Doji
The Doji is said to occur when the opening and closing
prices are roughly equal. That is, essentially a bar that has an open price
nearly equal to its close price, indicating a potential reversal. Mostly
important is the situation of occurrence at market tops after a protracted
uptrend, where there is a sign of indecision among buyers.
Importance of the Doji
A valid Doji has the same opening and closing price,
although minor differences are permissible. It is a warning sign, especially
when occurring in crucial market phases. Confirmation by the follow-up
candlesticks increases the reversal potential.
Doji occurring at the market tops indicate the possibility of a change in trend, especially when there is a strong uptrend, whereas Doji at the bottoms need stronger confirmation due to the selling pressure nature.