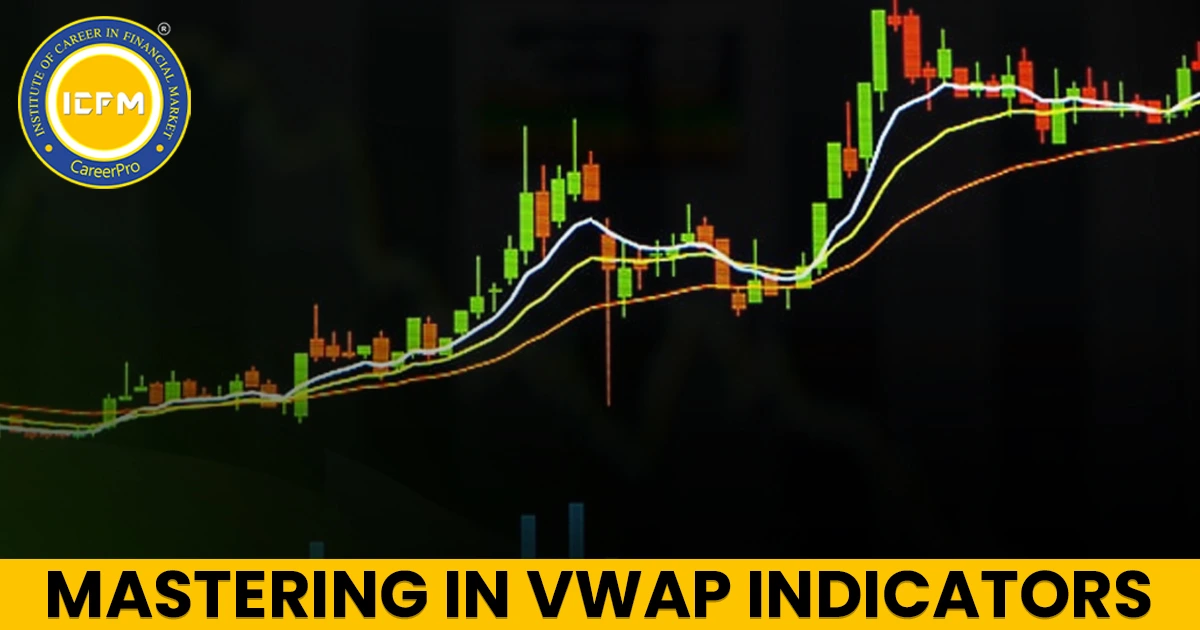
The Role of Volume in TechnicalAnalysis: An In-Depth Guide
Volume is a critical part of technical analysis that traders pay little heed to. However, it represents a critical factor in furthering the confirmation of price movements and the indication of potential market shifts. Trading stocks, forex, cryptocurrencies,or commodities will benefit from more insight into market behaviour if the trader has access to an understanding of volumes.
In this blog, we cover the importance of volume in technical analysis, how to interpret it, and a variety of applications.
What is Volume in Technical Analysis?
It is the amount of shares, contracts, or units traded in the asset in a specific period in technical analysis. This measures how many times the given asset changes hands within a specified time frame for instance, in one day, one week, or one hour. It isusually graphed as a histogram at the bottom of price charts, where each bar represents the volume for that specific period.
Why Is Volume Important in Technical Analysis?
Volume is classified, for the most part, as a "confirmatory" indicator because it gives insight into the strength or weakness of any trend price. Typically, high volume indicates strong market participation, while low volume may reflect a lack of conviction or uncertain market sentiment.
Why is volume so crucial :
1. Confirms Trend: can confirm the strength of a price move. A price movement occurring with substantial volume is taken more seriously and likely to be extended than a move that occurs with low volume.
2. Shows the Possibility of Reversals: High volumes in changes may show that there is a possible reversal or market tops/bottoms. Increasing volumes when the long-term trend ends can imply that the trend has exhausted all its steam; low volumes in the reversal may indicate that there is no follow-through.
3. It's a Market SentimentIndicator: Volume reflects the intensity or passion associated with an asset. Increased volume generally suggests that the people are very enthusiastic or very interested, and a declining volume might suggest apathy or indecisiveness.
4. Breakout Confirmation: Volume, when an asset breaks out from a critical level of support or resistance, can be a strong indicant. If the high volume is involved in the breakout of an asset from the level of support or resistance, then it confirms the breakout, meaning that the move has major market participation supporting it and is likely to sustain.
How To Interpret Volume In Technical Analysis:
While volume on its own doesn't give much of a trading signal, when used in combination with price action and other indicators, it starts to build useful insight. These are some of the most significant ways volume is analyzed in technical analysis:
1. Relationship between Volume and Price
In this most basic analysis, volume is observed for how it correlates with price movement. Here are some key relationships:
- Price In-Upside Trend with Volume Up: The signal for strong buying interest and up-uptrend would be when the price of an asset is moving up, and the volume is increasing.
- Price Up, Volume Down: This is a sign that the uptrend is weak because fewer and fewer buyers are entering into the rally, hence weaker to be reversed.
- Price Down, Volume Up: When the price of an asset is going down and the volume on which it is done is increasing, then it means that there must be strong selling pressure, generally speaking, which is the kind of confirmation the downtrend needs.
- Falling Price with Falling Volume: In case the prices are falling, but volume is also falling, that can indicate an interest in selling. The downtrend may be running out of steam, and the reversal or consolidation is near.
2. Volume Spikes
A volume spike refers to a sudden increase in trading activity within a short period. Volume spikes can be significant and signal a potential change in market direction. Key observations regarding volume spikes:
- Breakout Confirmation: When an asset breaks out from a consolidation range or a key resistance/support level, a volume spike can confirm the breakout. High volume indicates strong participation, making the breakout more reliable.
- Climactic Volume: A climactic rise in volume can be a sign that the asset has entered an overbought or an oversold position. This may possibly reverse the situation, given that the price movement is becoming extreme or erratic.
3. Volume Indicators
Different technical indicators include volume to help in this process of interpretation of market conditions:
On-Balance Volume (OBV): OBV is a momentum-based indicator that reflects the changes in stock price through volume flow. Theoretically, the calculation for OBV could not be simpler. If security closes higher than it did the previous day, then all of the volume for the day is considered positive. If it closes lower, the volume is negative . Falling OBV is seen as a sell signal, and rising OBV as a buy signal.
Accumulation/Distribution Line(A/D Line): This indicator compares the price movement with volume, indicating whether a stock is being accumulated (bought) or distributed (sold). Rising A/Dline suggests accumulation, while falling A/D line indicates distribution.
4. Volume in Reversals of the market :
Volume plays an important role in determining reversals of the market. Here are some volume-based reversal patterns:
- Volume at Support/Resistance: Just before a strong support or resistance level, volume analysis can predict if a breakout or reversal will occur or not. A high volume at the support level might mean strong buying pressure, while a high volume at the resistance level could be an indication of selling pressure.
- Volume Divergence: A price is making new highs (or lows) but the volume is going lower. This usually indicates a weakening trend strength and hence a possible change in direction . Commonly known as negative volume divergence in case of an uptrend or positive volume divergence in case of a downtrend.
Key Takeaways
- Volume confirms price action: Aprice movement accompanied by high volume is more trustworthy than one with low volume.
- Volume helps identify market sentiment: Adding volume to a price action allows one to gauge whether or not the trend is going to continue or turn.
- Volume supports breakouts: High volume accompanying a breakout suggests the move is legit and sustainable.
Volume-based indicators: Tools such as OBV and A/D Line can provide additional channels for adding volume as an indicator to a strategy.
Suppose you have the right kind of training for trading. In that case, integrating volume analysis within it can give you a better view of the strong trends help you avoid false breakouts ahead of time and also predict market reversals. The volume thus, in your hands, gives you a more versatile view of how volume interacts with price action to a better understanding of the market's sentiment, thereby more informed decisions and effective trading strategies.


