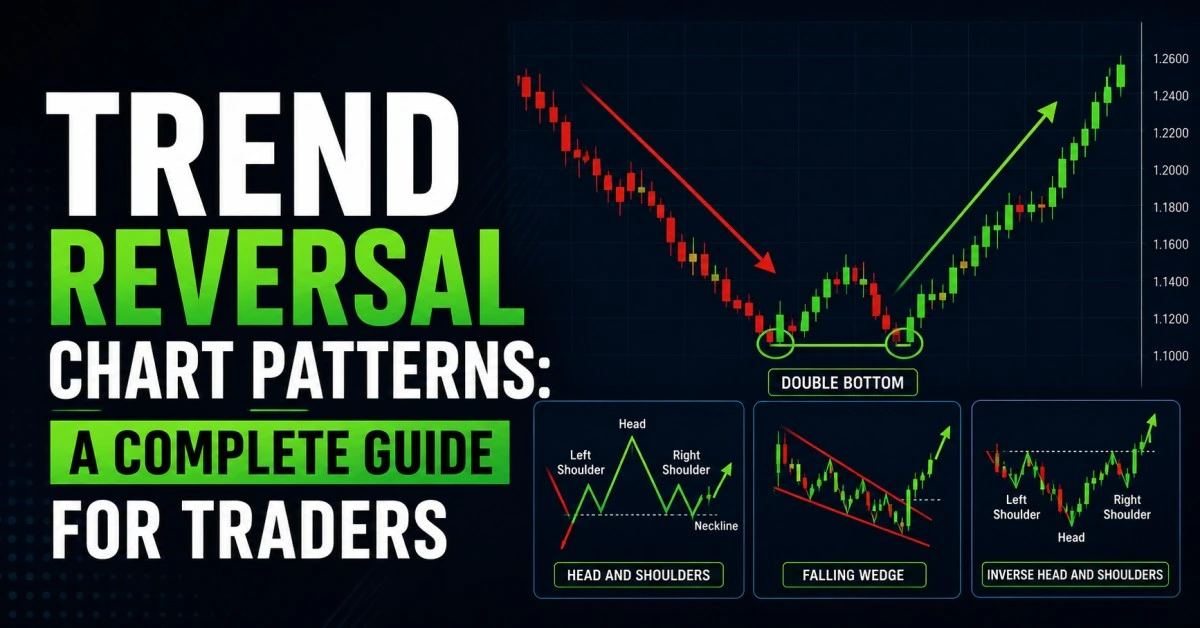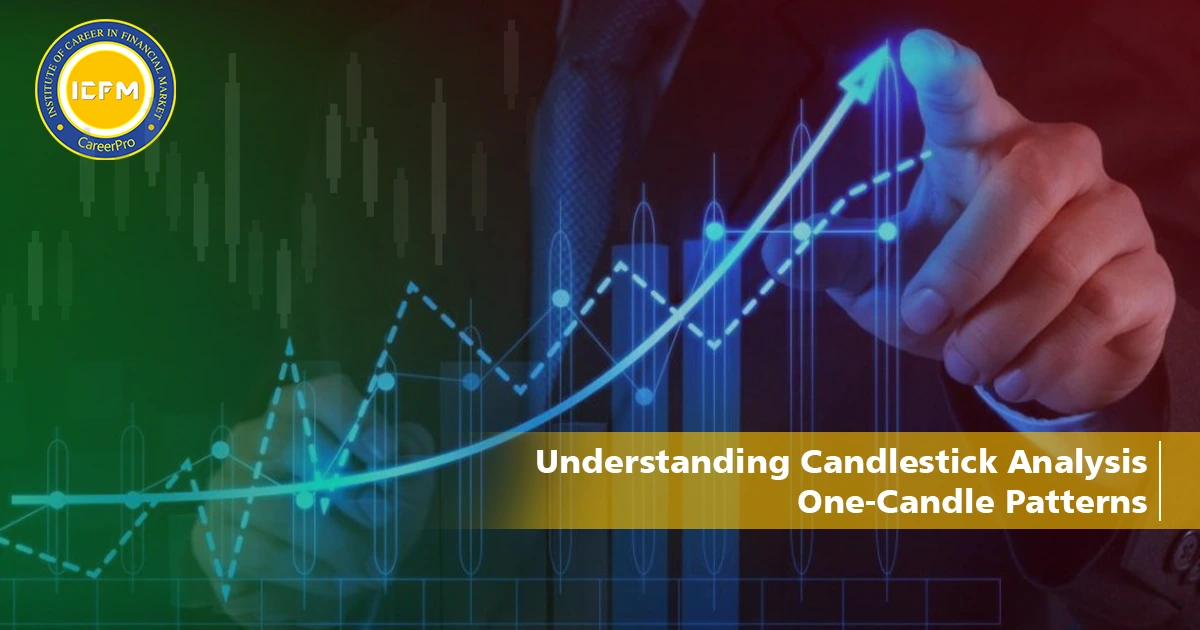
Understanding Candlestick Analysis: A Guide to Market Psychology
Candlestick analysis is quite powerful in the trading field. Such analysis helps investors evaluate market psychology while making decisions against it, having fear, greed, and hope. The inspection of the patterns under the candlesticks provides a deep understanding of the interaction between buyers and sellers and allows one to finally pick the best entry and exit points.
The Basics of Candlestick Analysis:
A candlestick is a graphical representation of price movements over a time period. Each candlestick is divided into two parts: the body and shadows (or wicks). A white candlestick indicates that at the time when the opening price was lower than the closing price, and a black candlestick shows that the price at opening was higher than at closing. Top and bottom shadows represent the highest and lowest prices during the trading period.
One-Candle Patterns: Umbrella Lines:
(A) The Hammer:
- There is a lower shadow at least two times the size of the body.
- There is little or no upper shadow for the body.
- The real body seems positioned at the high side of the trading range.
- A white candle on the following day confirms the signal.
- The longer the lower shadow, the more likely it is to be a reversal.
- High trading volume on the Hammer day strengthens the reversal signal.
- A gap down from the close of the previous day, yet a higher open the next day, strengthens the reversal signal.
Pattern Psychology:
(B) The Hanging Man:
Hanging Man This is a formation that occurs in an uptrend, and its body can be black or white. The Hanging Man signals a potential top reversal but can only be confirmed in the next trading session. It has little, if any, upper shadow.
(C) Inverted Hammer and Shooting Star:
there are Inverted Hammer and Shooting Star, which represent Hammer and Hanging Man patterns. Each of these patterns has low real bodies and long upper shadows to suggest a possible reversal.
1. Inverted Hammer:
- If the body is real one then an upper shadow must be at least twice the size.
- Little or no lower shadow.
- Confirmation from a positive day following the Inverted Hammer.
- A longer upper shadow increases the risk of a reversal considerably.
- A gap down from the previous day's close with a strong open the following day really amplifies the signal.
- Heavy trading volume on the day of the Inverted Hammer would suggest significant buying interest.
Pattern Psychology:
Therefore, once the price had dropped, if the price opened higher but continued to trade near the lower end of the trading range, then it would indicate that buyers were entering the market only to be answered by greater selling force. A second positive day would further support the reversal signal.
2. The Shooting Star:
- A very short body with an upper shadow longer than twice the body length.
- Gap up on an uptrend.
- True body occurring near the bottom of the price range, and it has either no or a very minor lower shadow.
- A greater upper shadow in the Shooting Star makes the reversal stronger.
- A gap up from the close then an open less in the following day strengthens the signal
- High volume on the Shooting Star day indicates it's a blow-off.