
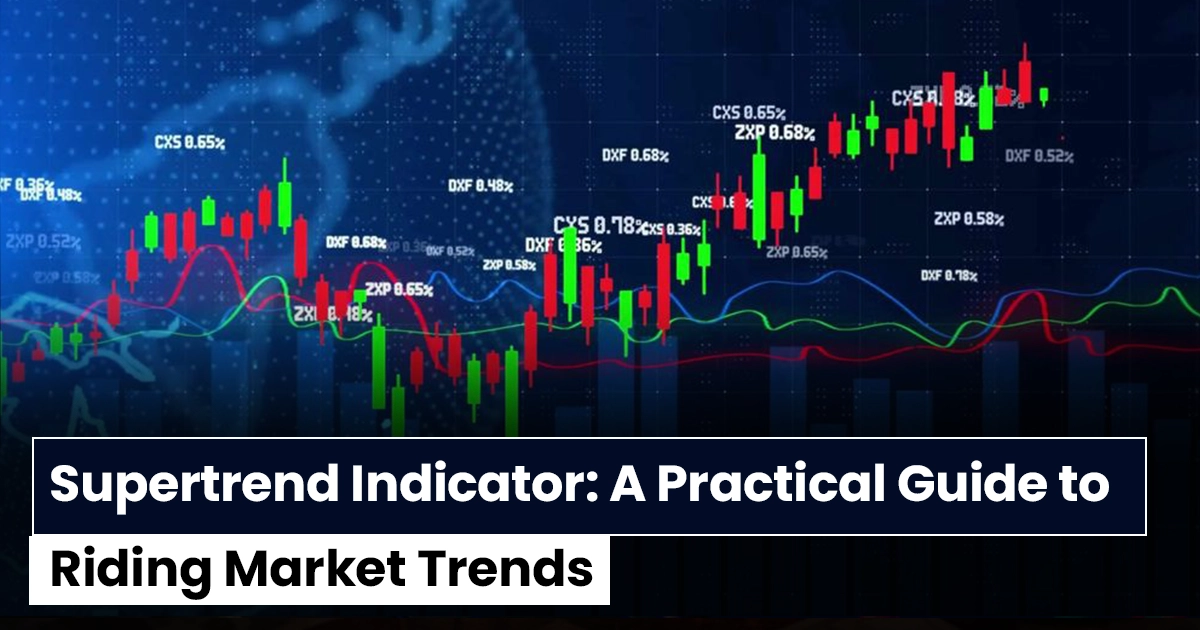
In trading, one of the most persistent challenges is identifying the direction of the market and staying aligned with it. ....
In trading, one of the most persistent challenges is identifying the direction of the market and staying aligned with it. ....
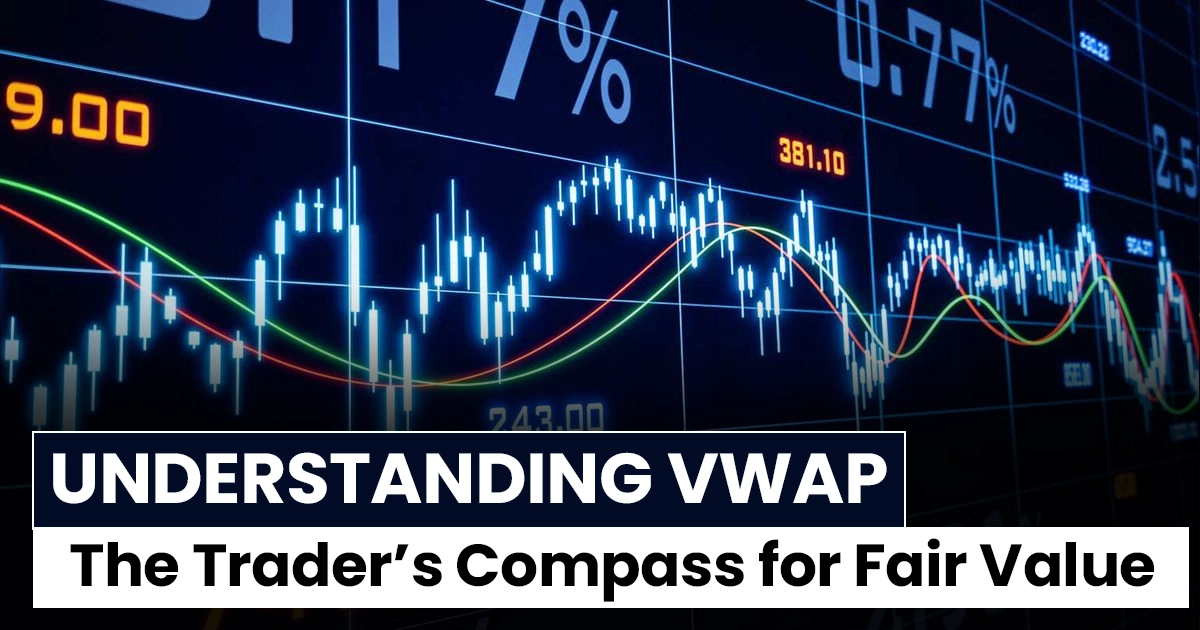
In the fast-moving world of financial markets, traders constantly search for tools that can bring clarity to price action. One ....

In the vast world of financial markets, few debates are as enduring as the one between technical analysis and other ....
If you’re entering the stock market or trying to refine your trading style, one question inevitably comes up: Should you ....

Learn how to build a rules-based trading system from scratch using technical analysis. Covers trading style, strategy, risk management, stop ....
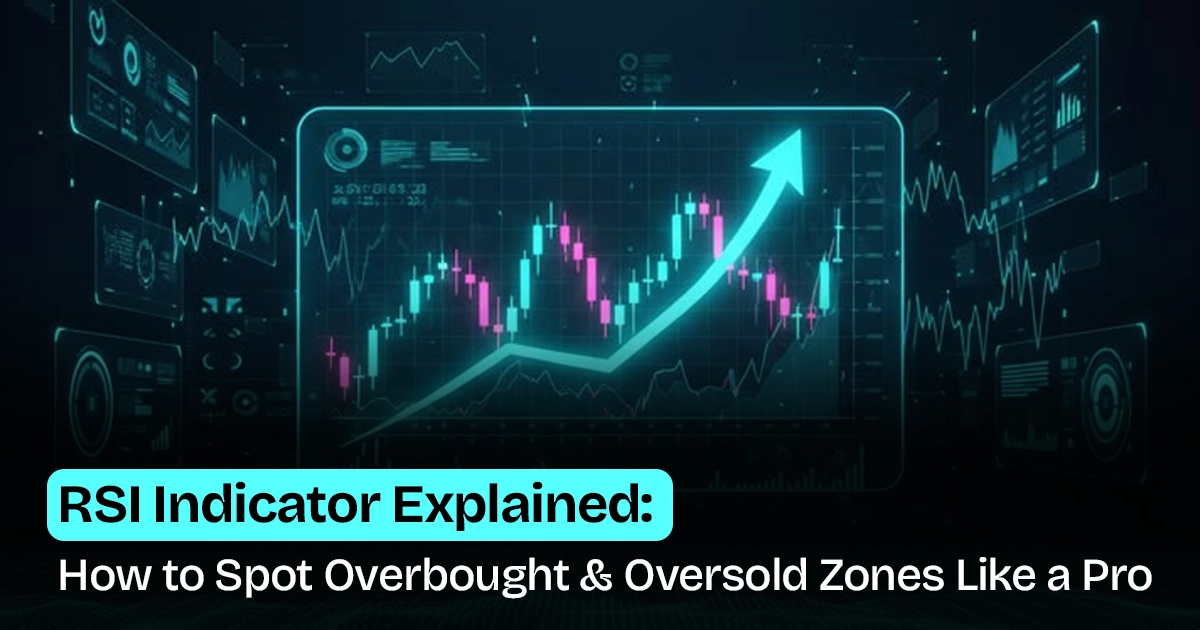
Master the RSI indicator for trading. Learn how to identify overbought and oversold zones, spot RSI divergence, and combine RSI ....
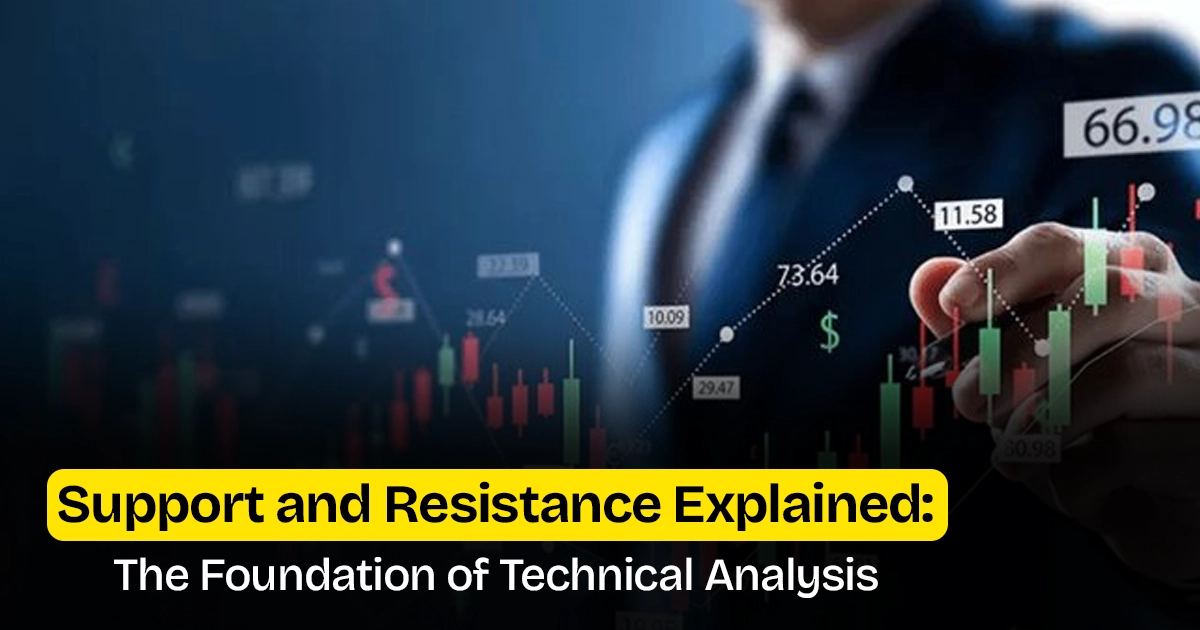
Understand how support and resistance levels work in technical analysis. Learn to identify key price zones, trade bounces and breakouts, ....

Learn the most important candlestick patterns in technical analysis. From Doji to Morning Star, discover how to read charts and ....

The pullback trading strategy is one of the most practical and low-risk approaches in technical analysis. Instead of chasing price ....
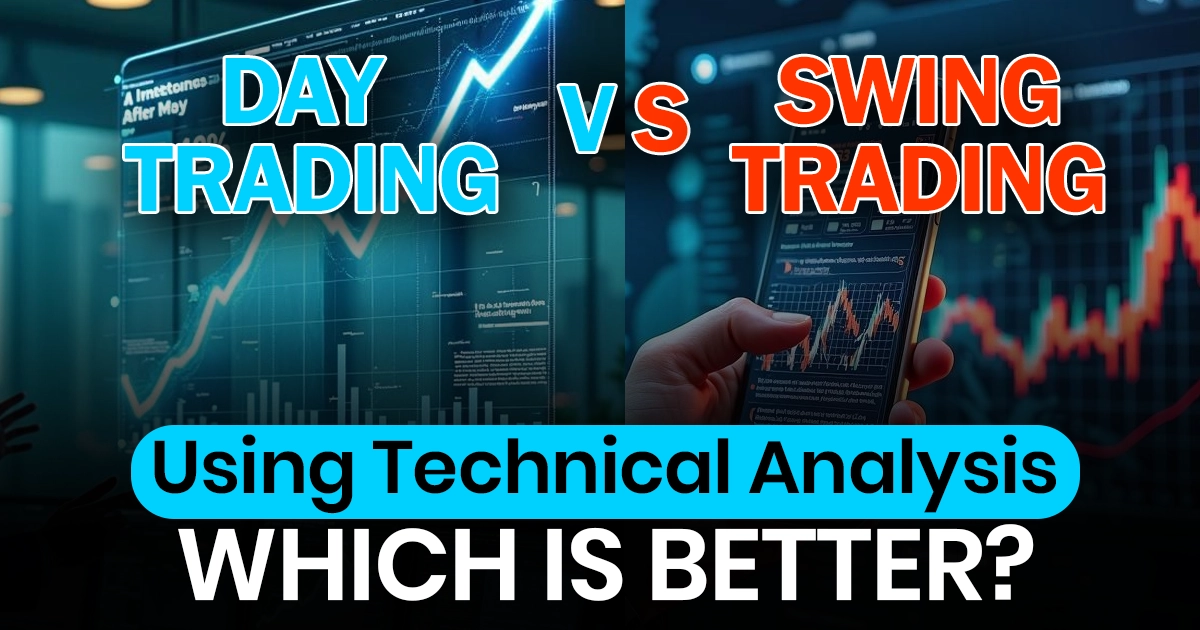
Day trading vs swing trading explained using technical analysis. Learn key differences in timeframes, indicators, risk, and which trading style ....
