
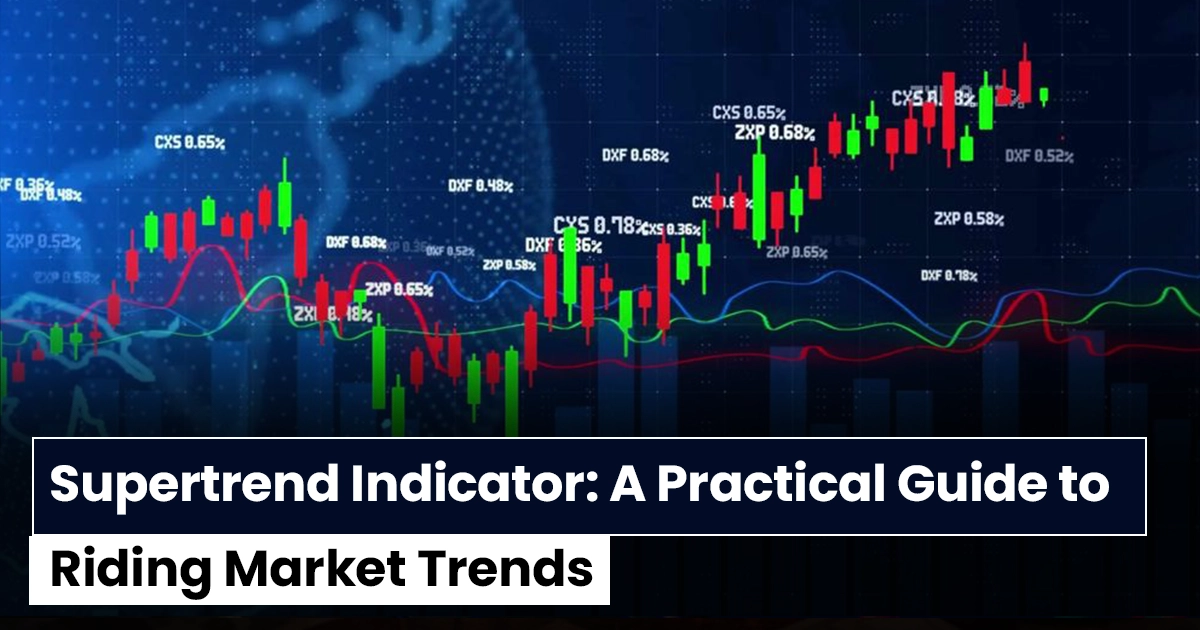
In trading, one of the most persistent challenges is identifying the direction of the market and staying aligned with it. ....
In trading, one of the most persistent challenges is identifying the direction of the market and staying aligned with it. ....
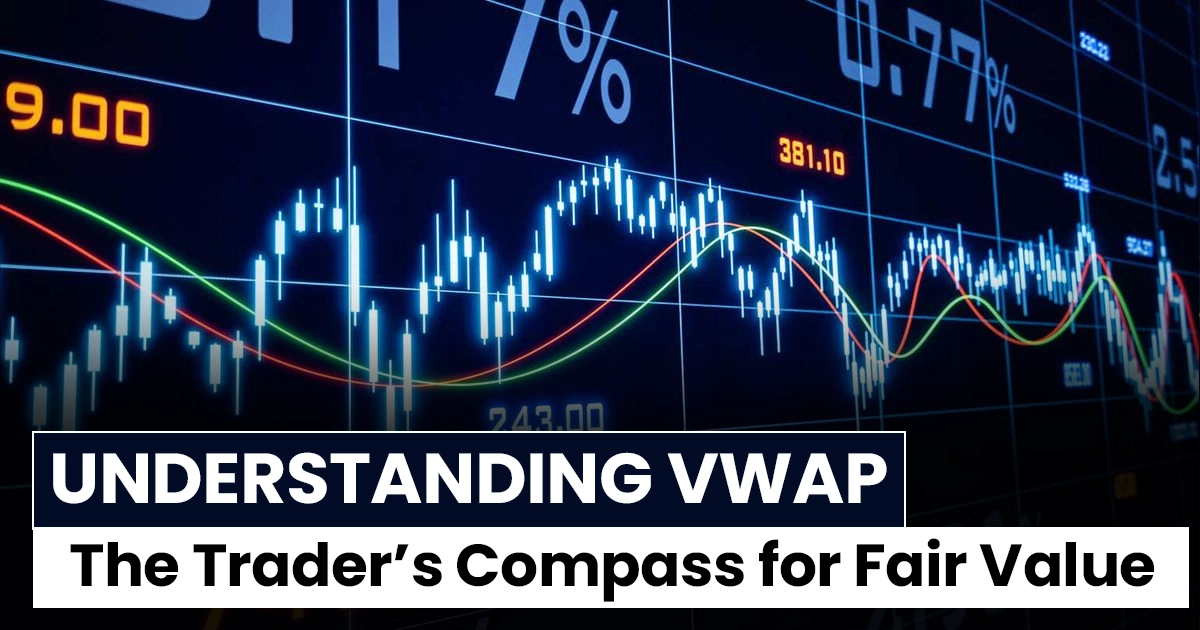
In the fast-moving world of financial markets, traders constantly search for tools that can bring clarity to price action. One ....
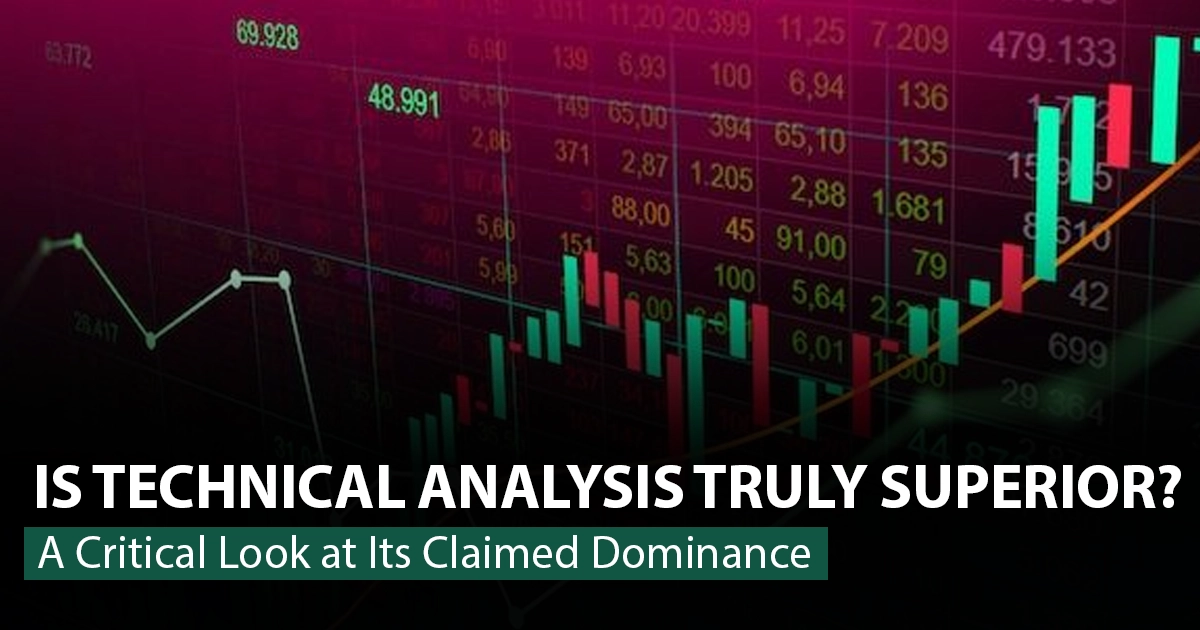
In the vast world of financial markets, few debates are as enduring as the one between technical analysis and other ....
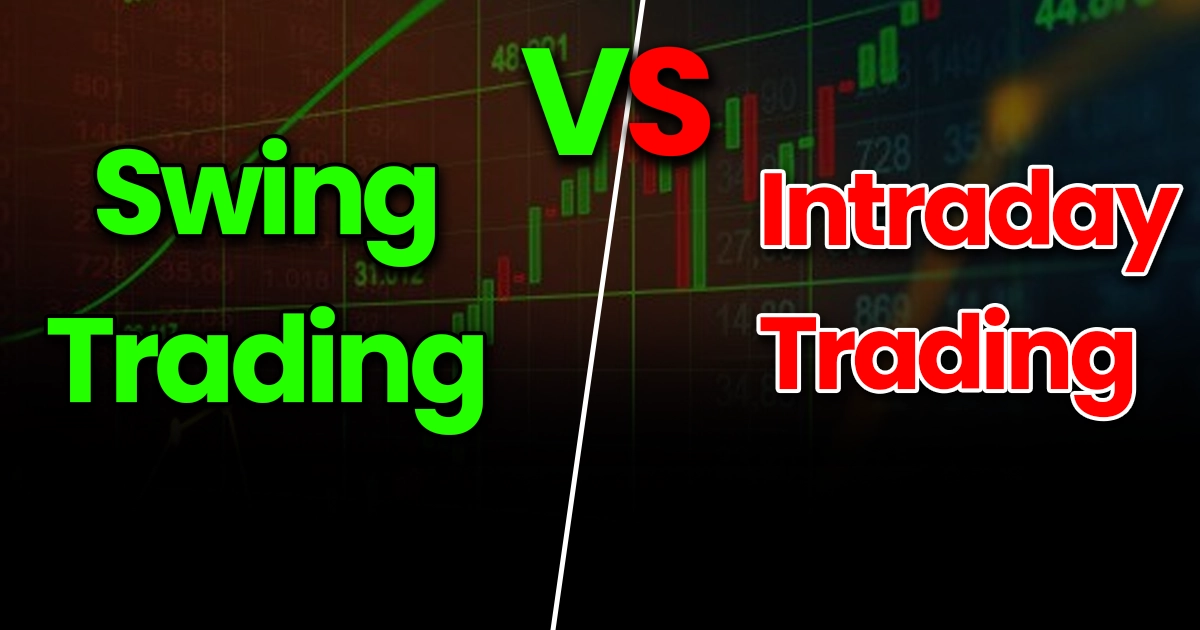
If you’re entering the stock market or trying to refine your trading style, one question inevitably comes up: Should you ....
Stop getting trapped in false breakouts. Learn how to distinguish genuine breakouts from fakeouts using volume confirmation, candle structure, retest ....
Understand Order Flow trading and how traders use real-time data like bid-ask, volume, and liquidity to identify market direction and ....
Understand Fair Value Gap (FVG), a powerful smart money concept used to identify price imbalances and high-probability trade setups in ....
Understand how Volume Profile works and how traders use POC, Value Area, and volume distribution to identify strong support and ....
Learn how the VWAP (Volume Weighted Average Price) indicator works and how to use it for intraday trading. Discover powerful ....
In the world of trading, few things are as frustrating as getting caught in a market trap — when prices ....
