

In the era of quick internet, discount brokerages, and chattering social media, becoming a "trader" has never been so simple. ....
In the era of quick internet, discount brokerages, and chattering social media, becoming a "trader" has never been so simple. ....
Stock market crashes can be frightening. For most investors, watching their portfolio lose value in a matter of weeks or ....

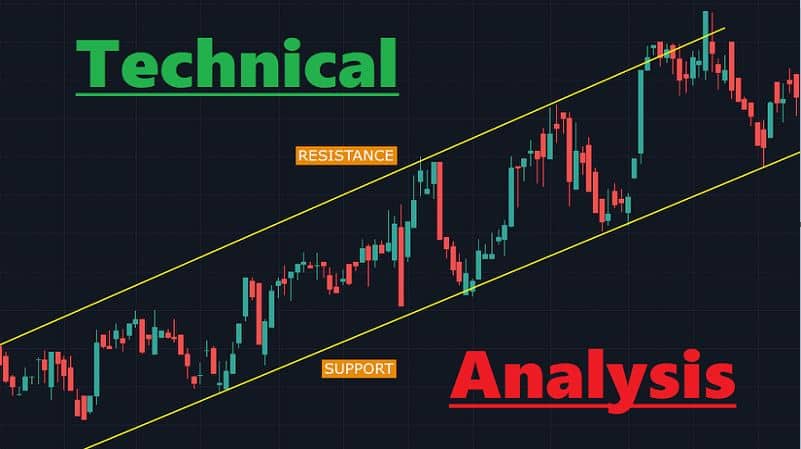
Technical analysis uses price charts, indicators, and volume to forecast stock and Nifty movements. It helps Indian traders make informed ....
Technical analysis is abounding with tools and ideas that try to predict price action, and not many are as popular ....
In technical analysis, few events thrill traders as much as a breakout or breakdown. Such price action tends to mark ....

In trading, some consider chart patterns to be nothing more than technical abstractions—shapes on a chart that in some way ....
This is a human tendency. It is our tendency to search for data which confirms what we wish to believe ....
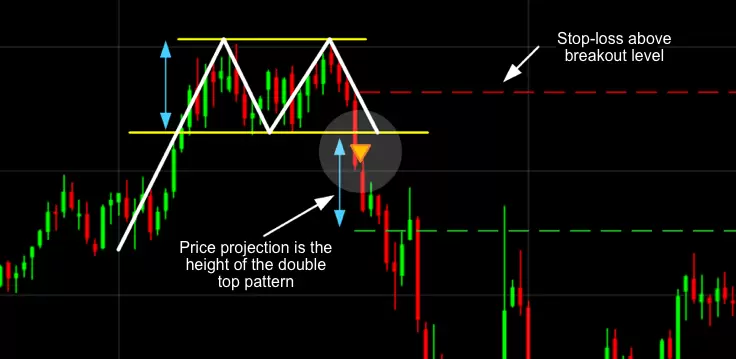
Trade Like a Pro: Mastering the Double Top and Powerful Pattern Combos The stock market can look like a jungle ....
Technical analysis (TA) has been a popular tool for financial market traders for a long time. It entails analyzing price ....

Sideways or range-bound markets exist when the price of an asset fluctuates within a given range, neither distinctly trending upwards ....
