Quick Answer: What Is Technical Analysis?
Technical analysis is the method of predicting future price movements by studying historical price charts, trading volume, and market patterns. It assumes that all market information is already reflected in the price, that prices move in trends, and that history repeats itself. Indian traders use it primarily on NSE instruments like Nifty 50, Bank Nifty, and individual stocks.
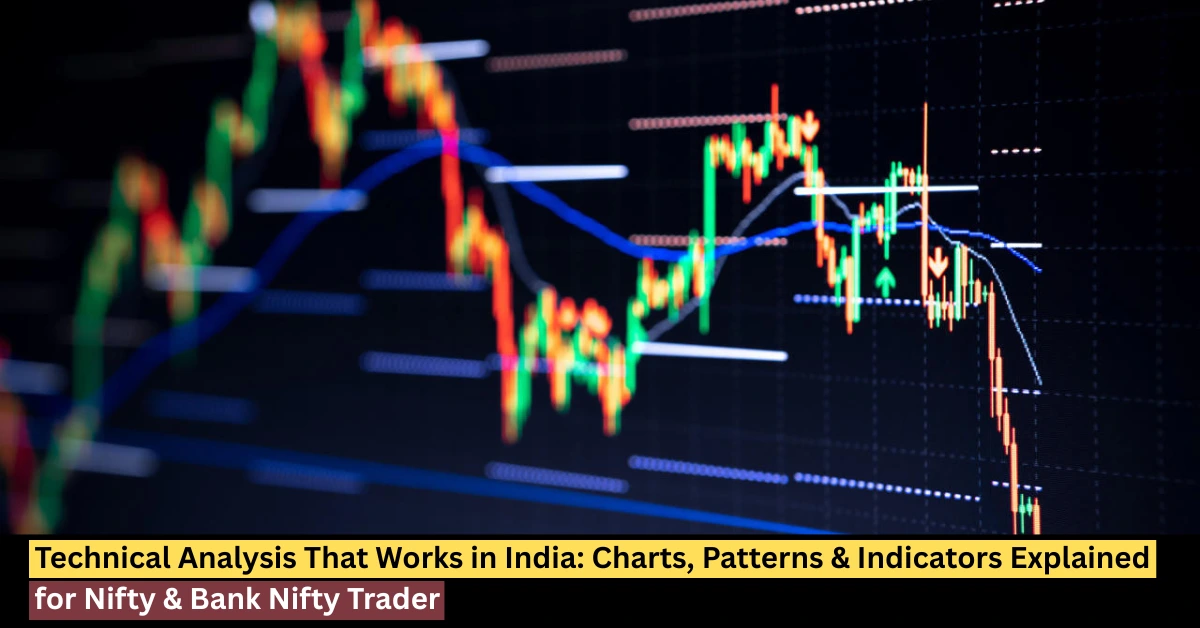
Why Technical Analysis Is Essential for Indian Traders
India's stock market — anchored by NSE and BSE — sees over ₹50,000 crore in daily F&O turnover. Retail participation has exploded since 2020, with over 13 crore demat accounts active. In this environment, technical analysis is not optional — it is the language the market speaks.
Unlike fundamental analysis, which evaluates a company's financials over months, technical analysis gives you actionable signals today. Whether you trade Nifty weekly options, swing trade mid-cap stocks, or invest in ETFs, understanding charts, indicators, and patterns is the single most transferable skill in the market.
ICFM has trained 15,000+ students in technical analysis since 2008. Our faculty bring 50+ combined years of live market experience trading Indian equities, derivatives, and commodities.
This guide covers everything — from the very basics of reading a chart to advanced multi-timeframe analysis and indicator combinations used by professional traders. Bookmark it, work through it section by section, and use the internal links to go deep on any topic.
1. Foundations of Technical Analysis
The Three Core Principles
All of technical analysis rests on three foundational ideas, originally articulated by Charles Dow in the late 1800s and still as relevant in India's markets today:
- Market discounts everything: The current price of Nifty, any stock, or any commodity reflects every known piece of information — earnings reports, RBI decisions, FII flows, and market sentiment. You do not need to independently research all these factors; the chart already knows.
- Prices move in trends: Markets do not move randomly. They trend upward (bull trend), downward (bear trend), or sideways (consolidation). Identifying and trading in the direction of the trend is the core edge of technical analysis.
- History repeats itself: Human psychology drives markets. Fear and greed create the same chart patterns — support levels, breakouts, head and shoulders, double tops — again and again. Recognising these patterns gives you a probability edge.
Technical Analysis vs Fundamental Analysis
| Factor | Technical Analysis | Fundamental Analysis |
| Focus | Price, volume, patterns | Revenue, EPS, P/E ratio |
| Time horizon | Minutes to weeks | Months to years |
| Data source | Charts and indicators | Financial statements |
| Best for | Trading, F&O, intraday | Long-term investing |
| Speed of signal | Real-time | Quarterly (results season) |
| Learning curve | 2–6 months | 6–18 months |
Most professional traders in India use a blend — fundamental analysis to select which stocks to watch, technical analysis to time their entry and exit precisely.
2. Reading Price Charts — The Essential Skill
Types of Charts
Before studying patterns or indicators, you must be comfortable reading price charts. The three chart types every Indian trader must know:
a) Candlestick Charts
The most popular chart type for Indian markets. Each candle represents one time period (1 minute, 15 minutes, daily, etc.) and shows four data points:
- Open price: Where the price started in that period
- Close price: Where the price ended in that period
- High price: The highest price reached in that period
- Low price: The lowest price reached in that period
Green (bullish) candle: Close is higher than open — buyers were in control.
Red (bearish) candle: Close is lower than open — sellers were in control.
b) Line Charts
Plots only the closing price over time. Useful for identifying overall trend direction and support/resistance on higher timeframes. Less noisy than candlestick charts, but provides less detail.
c) Bar Charts (OHLC)
Shows open, high, low, and close as a vertical bar with horizontal ticks. Less widely used in India today but still appears on older platforms and in international trading literature.
ICFM Tip: Always start your analysis on a daily or weekly chart to identify the primary trend. Then zoom into 15-minute or hourly charts for precise entry points. This is called top-down analysis and is the standard approach among professional traders. To learn this method in a structured way, explore our technical analysis course.
3. Support and Resistance — The Foundation of Every Trade
If technical analysis has a single most important concept, it is support and resistance. Every chart pattern, every indicator, every trading strategy ultimately refers back to these two levels.
What Is Support?
A support level is a price zone where buying pressure is strong enough to stop or reverse a downward move. Think of it as the floor. When Nifty falls to 22,000 and bounces three times without breaking below, that level is strong support.
What Is Resistance?
A resistance level is a price zone where selling pressure prevents further upward movement. The ceiling. When Nifty rallies to 24,500 and reverses three times without closing above it, that is strong resistance.
Why These Levels Form
- Round numbers (22,000, 23,500, 50,000 on Sensex) attract clusters of buy and sell orders
- Previous highs and lows are remembered by the market's participants
- Moving averages (50 EMA, 200 EMA) act as dynamic support/resistance
- Fibonacci retracement levels cluster buyers and sellers at predictable zones
Support Becoming Resistance (and Vice Versa)
When a support level is decisively broken, it typically becomes resistance on any subsequent rally. This role reversal is one of the most powerful and reliable concepts in technical analysis. When Nifty broke the 20,000 support in 2022, that level became resistance on the way up.
See our detailed guide — Support and Resistance: How to Identify and Trade Key Levels in Indian Markets — for real Nifty chart examples with entry, stop loss, and target levels.
| Pattern | Appearance | Signal | Reliability |
| Doji | Open ≈ Close, small body | Indecision, potential reversal | Medium |
| Hammer | Small body, long lower wick | Bullish reversal at support | High |
| Shooting Star | Small body, long upper wick | Bearish reversal at resistance | High |
| Marubozu | No wicks, large body | Strong trend continuation | High |
| Spinning Top | Small body, equal wicks | Indecision, trend weakening | Low-Medium |
Two-Candle Patterns
- Bullish Engulfing: Large green candle completely engulfs the previous red candle — strong buy signal at support
- Bearish Engulfing: Large red candle engulfs previous green candle — strong sell signal at resistance
- Piercing Pattern: Green candle closes above the midpoint of previous red candle — moderate buy signal
- Dark Cloud Cover: Red candle closes below midpoint of previous green candle — moderate sell signal
Three-Candle Patterns (Most Reliable)
- Morning Star: Red candle → small indecision candle → large green candle. Bullish reversal after downtrend.
- Evening Star: Green candle → small indecision candle → large red candle. Bearish reversal after uptrend.
- Three White Soldiers: Three consecutive green candles, each closing higher. Strong uptrend continuation.
- Three Black Crows: Three consecutive red candles, each closing lower. Strong downtrend continuation.
Important: No candlestick pattern works in isolation. Always confirm with volume (pattern + high volume = much stronger signal), support/resistance context, and at least one indicator. ICFM teaches a complete confirmation framework used in live markets. See our complete candlestick patterns guide with Nifty examples. For RSI-based confirmation signals, read our guide on RSI confirmation.
5. Chart Patterns — The Big-Picture Signals
While candlestick patterns reveal what is happening in one or two periods, chart patterns develop over days, weeks, or months and signal major trend reversals or continuations. These are the patterns institutional traders watch most closely.
Reversal Patterns
a) Head and Shoulders (Most Reliable Reversal Pattern)
Forms at the top of an uptrend. Three peaks — a higher middle peak (head) flanked by two lower peaks (shoulders). The neckline connects the troughs between the peaks. A close below the neckline confirms the reversal.
Target: Measure the height from head to neckline and project that distance below the breakout point.
Inverse Head and Shoulders: The mirror pattern at the bottom of a downtrend — one of the most reliable buy signals in technical analysis.
b) Double Top and Double Bottom
Double Top (M pattern): Price tests resistance twice, fails both times. Confirmed when price closes below the trough between the two peaks. Bearish signal.
Double Bottom (W pattern): Price tests support twice, bounces both times. Confirmed when price closes above the peak between the two troughs. Bullish signal.
Continuation Patterns
- Flags: Sharp move followed by tight consolidation in a channel. Break in the original direction targets a move equal to the flagpole. Very common on Nifty after major gap-up or gap-down opens.
- Pennants: Similar to flag but the consolidation forms a symmetrical triangle. Breakout in the direction of the original trend.
- Triangles (Ascending, Descending, Symmetrical): Converging price action. Ascending (flat top, rising bottom) = bullish. Descending (flat bottom, falling top) = bearish. Symmetrical = neutral, trade the breakout.
- Cup and Handle: Long, rounded base forming a 'U' shape, followed by a short pullback (handle). Breakout above handle resistance targets a move equal to the cup depth.
For a comprehensive deep-dive with real examples, read our chart patterns guide — head and shoulders, flags, triangles. Want to practice reading these patterns on live Nifty charts? Join our live market sessions.
6. Technical Indicators — Your Decision-Making Tools
Indicators are mathematical calculations applied to price and volume data. They help you quantify trend strength, identify overbought/oversold conditions, and time entries. Used alone, indicators lag. Used in combination with price action, they are powerful.
The Big Four Indicators for Indian Markets
| Indicator | Best For | Signal Type |
| RSI (Relative Strength Index) | Momentum measurement | Overbought >70, Oversold <30 |
| MACD | Trend + momentum | Crossover signals, divergence |
| Bollinger Bands | Volatility + mean reversion | Band squeeze, breakouts |
| EMA (Exponential Moving Average) | Trend direction | Price vs EMA, crossovers |
RSI — Relative Strength Index
RSI measures the speed and magnitude of recent price changes on a scale of 0 to 100. Developed by J. Welles Wilder. The most popular momentum indicator used by Indian traders.
- RSI above 70: Overbought zone — potential reversal or slowdown. In strong uptrends, RSI can stay above 70 for extended periods (trend continuation).
- RSI below 30: Oversold zone — potential bounce or reversal. In strong downtrends, RSI can stay below 30 (avoid buying immediately).
- RSI Divergence (most powerful use): Price makes a new high but RSI makes a lower high — bearish divergence, strong reversal signal. Price makes a new low but RSI makes a higher low — bullish divergence.
ICFM Setting for Indian Markets: 14-period RSI on daily chart. For intraday Nifty, use 14-period RSI on 15-minute chart.
MACD — Moving Average Convergence Divergence
MACD plots the difference between two EMAs (typically 12-period and 26-period) as a line (MACD line), along with a 9-period EMA of that line (signal line), and a histogram showing the difference between the two. To master MACD in a structured curriculum, see our certified technical analyst course.
- MACD line crosses above signal line: Bullish crossover — potential buy
- MACD line crosses below signal line: Bearish crossover — potential sell
- Histogram growing taller: Momentum increasing in the current direction
- MACD divergence: Same concept as RSI divergence — extremely powerful when both RSI and MACD show divergence simultaneously
Bollinger Bands
Bollinger Bands plot two standard deviations above and below a 20-period SMA, creating a dynamic channel. When volatility increases, the bands widen. When volatility contracts (band squeeze), a major move is imminent. Volatility traders using options can benefit from our advanced options trading course.
- Price touching upper band: Overbought in the short term — potential pullback
- Price touching lower band: Oversold in the short term — potential bounce
- Band squeeze (bands narrow sharply): Explosive move coming — trade the breakout in either direction
- Walking the bands: In strong trends, price 'walks' along the upper (uptrend) or lower (downtrend) band — do not sell just because price is at the upper band in a strong uptrend
Moving Averages — Trend Filter
Moving averages smooth price data to reveal the underlying trend. The two most important for Indian markets:
- 20 EMA: Short-term trend, used by swing traders and intraday traders on daily/hourly charts
- 50 EMA: Medium-term trend, institutional traders watch this level on daily charts
- 200 EMA: Long-term trend, the 'golden cross' (50 EMA crosses above 200 EMA) is one of the most bullish signals
Golden Rule: Trade in the direction of the 200 EMA. If price is above the 200 EMA, look for buy setups. If price is below, look for sell setups or avoid longs.
7. Volume Analysis — Confirming Every Signal
Price tells you what is happening. Volume tells you how much you can trust it. No technical analysis is complete without understanding volume.
| Price Action | Volume | Interpretation | Reliability |
| Price rises | Volume rises | Strong uptrend, genuine buying | Very High |
| Price rises | Volume falls | Weak rally, potential fake-out | Low |
| Price falls | Volume rises | Strong downtrend, genuine selling | Very High |
| Price falls | Volume falls | Weak pullback in uptrend, likely to reverse | High |
| Price breakout | Volume spike (2x+ average) | Valid breakout, high follow-through | Very High |
| Price breakout | Low volume | False breakout, potential trap | Low |
Volume Indicators
- OBV (On-Balance Volume): Cumulative volume indicator. Rising OBV confirms uptrend; OBV divergence (price rises but OBV falls) signals potential reversal.
- VWAP (Volume-Weighted Average Price): Used by institutional traders. Price above VWAP = bullish intraday trend. The most important intraday indicator for Nifty and Bank Nifty.
- Volume Moving Average: Plotting 20-day average volume helps spot abnormal spikes that often precede major moves.
8. Trend Analysis and Multi-Timeframe Framework
Identifying Trend Direction
A trend is defined by a series of higher highs and higher lows (uptrend) or lower highs and lower lows (downtrend). Structure analysis — identifying these swing points — is more reliable than any indicator.
- Primary trend (Weekly chart): The big picture — is the market in a multi-month bull or bear phase?
- Secondary trend (Daily chart): The trading trend — medium-term direction for swing trades
- Minor trend (Hourly/15-min chart): Entry and exit timing for active traders
Multi-Timeframe Analysis (MTF)
The highest-probability trades occur when multiple timeframes align in the same direction:
Step 1 — Weekly chart: Identify primary trend. Is Nifty above or below its 200-week EMA?
Step 2 — Daily chart: Identify secondary trend and key support/resistance levels.
Step 3 — 4-hour chart: Confirm trend alignment with daily chart.
Step 4 — 15-minute chart: Find precise entry trigger — candlestick pattern, indicator signal
MTF Rule: Only take a trade on the lower timeframe when it aligns with the higher timeframe direction. A buy signal on the 15-minute chart is significantly stronger when the daily and weekly charts are also bullish. For a practical framework with live examples, read our blog: how to build a complete trading system using technical analysis.
Dow Theory in Indian Markets
Charles Dow's original trend theory, adapted for modern Indian markets, defines six key principles. The most actionable for Indian traders: markets move in three phases. In a bull market — accumulation (smart money buys), public participation (majority enters), distribution (smart money sells). Recognising these phases on Nifty's weekly chart helps you avoid buying at the top.
9. Fibonacci Retracement and Extension
Fibonacci levels are derived from the famous Fibonacci sequence and appear naturally in financial markets. They identify the most likely levels at which a price pullback will find support before resuming the primary trend.
Key Fibonacci Retracement Levels
- 23.6% — Shallow pullback, seen in very strong trends
- 38.2% — Common pullback level in moderately strong trends
- 50.0% — Not a Fibonacci number but the most psychologically significant retracement
- 61.8% — The 'golden ratio', the deepest common retracement. Strong support in uptrends.
- 78.6% — Deep retracement, last level before the original move is considered failed
How to Draw Fibonacci on Nifty Charts
Identify a completed swing move — a clear high and a clear low.
In an uptrend: Draw from swing low to swing high. Fibonacci levels appear on pullbacks.
In a downtrend: Draw from swing high to swing low. Fibonacci levels appear on rallies.
Look for confluence — when a Fibonacci level coincides with a previous support, EMA, or pattern target, the probability of that level holding is significantly higher.
Pro Application: On Bank Nifty's weekly chart, the 61.8% Fibonacci retracement of major moves has consistently acted as a key reversal zone. ICFM faculty demonstrate this with live historical examples in our Technical Analysis course.
10. Trading Strategies for Indian Markets
Strategy 1 — Trend Continuation (EMA + RSI)
Setup: Price above 20 EMA and 50 EMA. RSI between 40–60 (pulling back from overbought, not oversold). Wait for bullish candlestick pattern at 20 EMA.
Entry: Buy on the close of the confirming bullish candle.
Stop Loss: Below the recent swing low or the 50 EMA.
Target: Previous high or 1.5x to 2x risk-reward minimum.
Strategy 2 — Breakout Trading (Volume Confirmation)
Setup: Price consolidating near resistance for 5+ sessions. Bollinger Band squeeze visible (bands narrowing). Watch for expansion.
Entry: Buy on close above resistance with volume at least 1.5x the 20-day average volume.
Stop Loss: Below the breakout candle's low.
Target: Measure consolidation range width and project above breakout level.
Strategy 3 — Reversal Trading (RSI Divergence + Pattern)
Setup: Price at key support. RSI below 30 with bullish divergence (price lower low but RSI higher low). Bullish reversal candlestick pattern (hammer, morning star, engulfing).
Entry: Buy on break of the reversal candle's high.
Stop Loss: Below the reversal pattern's low (or below support by 0.5%).
Target: Next resistance level. Trail stop loss using 20 EMA once trade moves in your favour.
Risk Management Rule: Never risk more than 1–2% of your trading capital on a single trade. This is the single most important rule for survival in markets. Most traders who fail do not fail because of bad analysis — they fail because of poor position sizing.
11. Applying Technical Analysis to Nifty & Bank Nifty Options
India's F&O market is the largest in the world by contract volume. Understanding how technical analysis applies specifically to Nifty weekly options and Bank Nifty is a critical skill for Indian traders.
Key Differences When Analysing Index Options
- Time decay (Theta): Options lose value daily. Technical setups must materialise quickly, especially for weekly expiry contracts.
- Implied Volatility (IV): High IV = expensive options. IV crush after events (RBI policy, budget, results) can destroy option value even if direction is correct.
- Options Chain Analysis: Open interest data in the option chain shows where large players have sold options — these strike prices often act as strong support/resistance.
- Max Pain: The strike price where maximum option buyers lose money. Price gravitates toward max pain as expiry approaches — a powerful technical signal specific to Indian markets.
Technical Levels for Nifty Options Trading
Weekly Support/Resistance: Plot weekly pivot points (Classic or Camarilla). These levels are widely watched and become self-fulfilling.
VWAP on Expiry Day: On Thursday (Bank Nifty expiry), VWAP is the most important intraday technical level. Direction relative to VWAP dictates bullish or bearish bias for the session.
PCR (Put-Call Ratio): PCR above 1.3 = excessive bearishness = contrarian buy signal. PCR below 0.7 = excessive bullishness = contrarian sell signal.