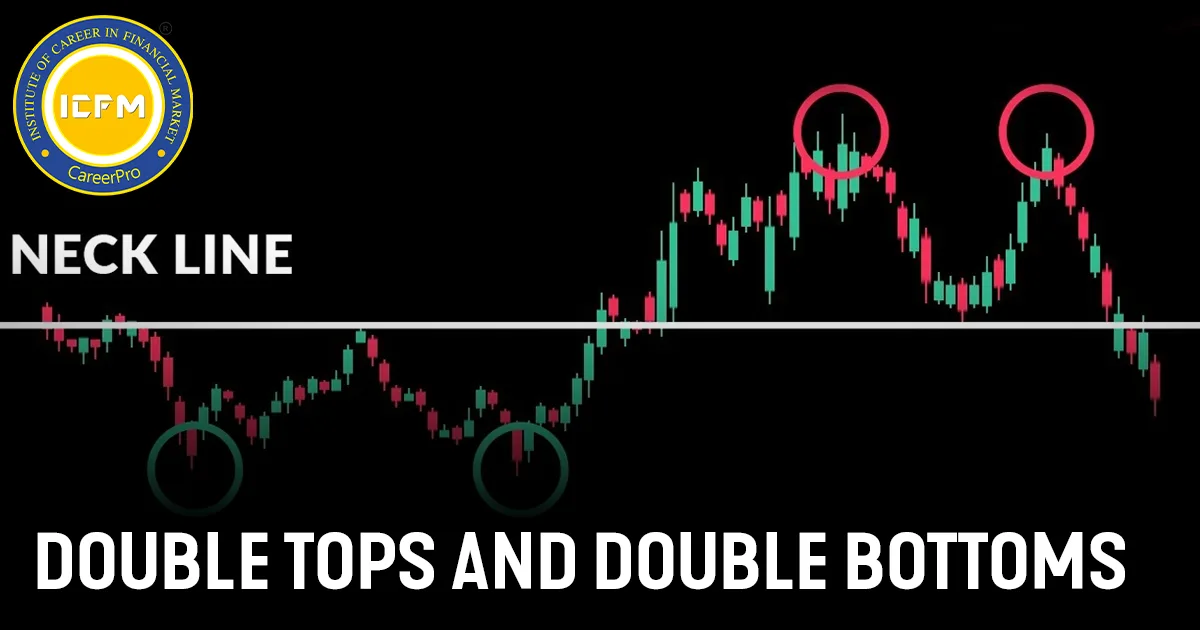
1. Double top:
A double top is a reversal pattern in technical analysis that occurs after an upward direction. The price rises, then dips, again rallies to reach almost the same level as the peak two times back, and then falls. It indicates a possible change to the downward motion.
(a) Essential Features:
> Prior Trend: There must exist an uptrend for several months before the formation of the pattern.
> First Peak: The first peak is the point marking the highest in the existing upward trend.
> Trough: The price typically goes down 10-20% from the initial peak and therefore sets a reaction low
> Second Peak: The price surges with thin volume until it hits resistance at the old high. In addition, there should not be any second peak beyond 3% of the first peak.
> Decline from Peak: A decline from this second peak has in most instances been marked by strong supply before demand, and most of the times it has been accompanied by high volume and sometimes gaps.
> Support Break: The double top is confirmed once the price breaks below the reaction low, with an increase in volume and/or accelerated decline.
(b) Step-by-Step Formation of the Double Top:
> Pre-Trend: The pattern occurs after a strong uptrend of several months.
> First Peak: Price reaches a new high, marking the peak of the uptrend.
> Trough: A correction occurs, typically ranging between 10-20%, forming a reaction low.
> Second Peak: The price again rises with very low trading volume and is sold down to break the old high. The second high cannot be more than 3% higher than the first high.
> Decline from High: After the second high price, the price begins moving downwards with advancing volume, which reflects the mood swings of the market.
> Support Break: The pattern is confirmed when the price breaks below the reaction low between the peaks. This is confirmed by increased volume and an accelerating decline.
> Support Turned Resistance: A broken support level may become a new resistance level, sometimes tested with a reaction rally.
> Price Target: The potential downside target is found by subtracting the distance from the reaction low to the peak from the reaction low. The greater the decline, the larger the pattern.
(c) Breakout Expectation:
> Confirmation: The double top pattern is confirmed when the price breaks below the reaction low (the support) with expanding volume.
> Price Target: Subtract the distance of a reaction low to the peak from the support level to arrive at the target.
> Significance: Double tops often signify a trend reversal, and the prices may collapse much more than the calculated price target.
Double tops are a bearish reversal pattern and often signify the end of an uptrend.
> Volume Confirmation: Moving up with increasing volume is an essential condition to confirm the pattern.
> Support and Resistance: Broken support levels often become resistance, which a rally could test after.
2. Double bottom:
A double bottom is a charting pattern, in technical analysis, to describe a price movement wherein a stock (or index) drops to a new low, rebounds, drops again to a similar low, and then rebounds again. It signals a potential reversal of a downtrend to an uptrend.
(a) Key Characteristics:
> Prior Trend: There must be an existing downtrend that lasts for several months before the double bottom pattern forms.
> First Trough: It is the price in the existing downtrend, having the lowest value.
> Top: After the first trough, prices bounce back from 10% to 20%. Then, it creates a reaction high showing a correction can occur.
> Second Trough: Price declined further and then had a second low near or at the former low. This is known as "double bottom." The decline always happens at a low volume.
> Resistance Break: The pattern is confirmed when the price breaks above the reaction high (the resistance level between the two troughs), signalling the reversal to an uptrend.
(b) Step-by-Step Steps of the Double Bottom Formation:
> Pre-Trend: A double bottom formation usually develops after a long period of downtrend, which takes several months.
> First Trough: The price contacts the trough of the current trend. That point is usually reasonably normal-looking, and a downtrend continues.
> Peak (Reaction High): The price goes up to gain 10-20% from the first trough. Usually, volume increases at this stage, indicating early accumulation. However, the price cannot push above the resistance level of the previous high.
>Second Trough: The price again drops, usually with low volume, and reaches the support at or close to the former low. The second trough should be within 3% of the first trough to be valid, but not have to align exactly, this creates the "double bottom" formation.
> Rally from Trough: The rally out of the second trough should be characterized by increasing volume and a sense of strong buying force. A runaway rally that may include gaps can be interpreted as a shift in the tide and the beginning of an uptrend.
> Breakout of Resistance: The bullish setup is confirmed when the price moves through the reaction high (the zone of resistance developed between the two troughs). The breakout typically has greater volume and/or increased price momentum.
> Resistance Becomes Support: Once resistance is broken, it often becomes support. A second test of this new support area may occur, creating an opportunity to enter longs or to cover shorts.
> Price Target: The price target for a double bottom is approximated by adding the distance from the resistance breakout to the trough low, to the resistance break. The larger the formation the greater the potential advance.
(c) Breakout Expectation:
>Confirms: the pattern only confirms as a double bottom if the price breaks up through the reaction high (resistance) with higher volume.
>Price Target: the price target is found by adding the depth from the reaction high to the trough to the level of the resistance break
>Significance: a successful double bottom breakout often leads to a big advance in the price sometimes going well beyond the price target.
(d) Key Points:
>Trend Reversal: The double bottom is a bullish reversal pattern that could mark the close of the downtrend and the start of the uptrend.
>Volume Confirmation: The volume then assumes an important role in confirming the pattern, especially during the advance from the second trough to breaking above resistance.
>Support and Resistance: Once support has been broken, it forms the first new level of support and adds up to the confirmation of reversal.


