For some time now, Technical analysis (TA) has been a favorite of financial traders for their markets.* It involves the examination of historical price charts, chart patterns, trading volume, and technical indicators to estimate the probable direction of future price movement.* It is used daily in making trading decisions in equities, foreign exchange, cryptocurrencies, and commodities.*
Like most things in life, TA also has its drawbacks..”
Identifying the Weaknesses of Technical Analysis
From the name alone, it's easy to discern that the primary goal of this technique is to analyze data scientifically, always relying on hard data, and, in turn, justifying every step of TAs with numbers.
The fundamental principles that accompanies most types of TA are:* pricing takes into account everything; pricing trends take place in a trend; and prices movement trends take place in the trend, and the price action will always take a repetitive pattern.
1. Effects of Unexpected Firms News and Other Events
An example of an event that changes completely system and technical analysis , an activity of Informational or macro news. This is because in order to forecast by using technical analysis, there must be some sort of historical price record which can be analyzed. However, for certain fundamental events, history may be of no importance and will be thrown out.
Let us look at some examples that can be grouped into different strategies:
- Firm specific news - Acquisition of firms, mergers of firms, lawsuits against firms.
- Economic Indicators - Changes in interest rates, inflation, and employment.
- Geopolitical - War, natural disasters.
Policy change: Unexpectedly tight regulations.
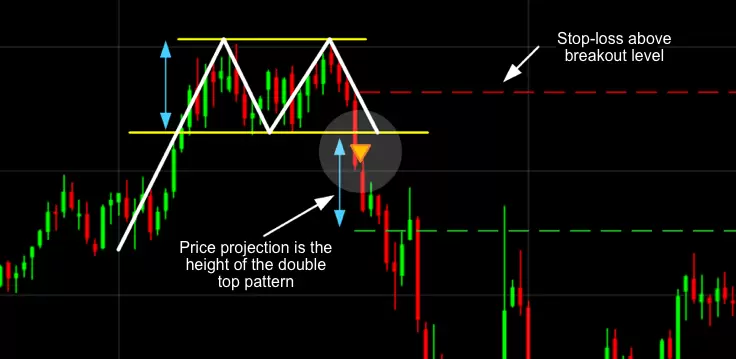
Consider the scenario where you see shares forming a bullish flag pattern, suggesting a likely price surge. But everything goes wrong when the corporation declares unsatisfactory earnings. The stock gaps down and destroys the entire technical setup. This situation is bound to happen because there will always be new information available that has no correlation to historical trends.
Ways to mitigate unexpected changes in the TA system:
- Closely follow an economic calendar to avoid trading right ahead of major news announcements.
- Make use of stop-losses to enable you avoid unexpected shifts.
Avoid over-relying on fundamental technical analysis during earnings season or politically sensitive periods.2. Low Liquidity Markets:
Liquidity describes how easily an asset can be purchased or sold and how this affects the asset's price. Low liquidity markets have very little liquidity, which means anything over a certain volume can cause unprecedented movement. This also means volume indicators as well as price patterns are too inaccurate to depend on.
Markets Commonly Found in:
- Penny stocks
- Small-cap equities
- Thinly traded forex pairs
- Emerging or low-cap cryptocurrencies
Such markets are susceptible to scams where a small number of traders control one side of the market making them the price setters, “marking the close”, resulting in massive buyer or seller orders that artificially drive demand or supply. Counter-trend orders placed by such a small number of traders during times of low trading velocity can manipulate volume patterns displaying trends when actually, there are none.
Relying on MAS, RSI, MACD, or Bollinger Bands to make decisions will have many traders operating under false reliance where happy to have signals deriving using overall price levels when such low demand cycles are inaccurate price drawing value.
What to do:
- Look for instruments with a high average daily volume.
- Avoid passive trading using just chart patterns for illiquid assets.
Use breakout trade patterns confirmed by volume to support the breakout validity.
3. Extremely Volatile Market Conditions:
Volatility describes the differing levels of price movement in an asset over time. In times of great volatility such as a pandemic, political turbulence, or financial crisis it isn’t uncommon for technical analysis to fail. The market breaks levels it previously accepted and unaccounted for changing trends that issue, fakes, and gives mixed signals among many other things.
Case in Point:
- The Financial Crisis of 2008.
- The COVID-19 Crash of 2020.
- The Flash Crashes of Crypto Currencies.
During such times, feelings drive all market activity. Chart patterns along with indicators are overridden by panic selling, fear combined with irrational greed. Even solid support and resistance levels break down suddenly without giving any indication. Technical traders are, more often than not, perplexed as price moves violently opposite from expectations.
What to do:
- Reduce position size to better manage risk.
- Employ wider stop-losses for better risk management or wait until lower volatility periods.
If conditions are too uncertain, it’s best to stay on the sidelines.
Choppy or Sideways Markets:
Markets never seem to trend consistently. They often move sideways within a narrow band. Under these conditions, most technical strategies, especially trend-followers, are aimlessly ineffective.
How It Happens:
- RSI and MACD oscillate buy/sell signals at an unrealistic pace paired with minimal follow-through.
- Above resistance or below support breakouts tend to be false more often than not.
No directional indication is given when moving averages flatten.
With these range-constrained conditions come the whipsaws. Traders make small profits and encounter losses in the process during their repeated in and out trades. It becomes evident that strategies which were deemed successful in a stable trending market become money drains when the market shifts.
What To Do:
Adopting range-trading procedures like buying near support and selling near resistance proves effective.
- Use indicators like Bollinger Bands and ADX to confirm low-trend strength.
- Avoid trend-following tactics during range-bound markets.
5. Context-Free Indicators: Overdependence Without Context:
A large number of traders seem to fall into the trap of using too many technical indicators, or worse, using them without understanding their limitations. Indicators are tools; not the strategists for the trades. Depending solely on them without understanding price movement, trading volume, and the broader context of the market appears to often create dire outcomes.
Examples of Perceived Mistake:
– Buying in a rush when RSI < 30 and vice versa when selling *(RSI > 70)*.
– Overuse of opposing indicators.
– Lack of distinction among lagging and leading indicators.
The focus is on the application of technical analysis rather than its existence. Furthermore, the chart does not display apparatus through which automatons move. It reflects human nature, thus revealing thoughtful exploration, planning, and actions well executed.
What to do:
Trade with a few reinforcing indicators and avoid basing decisions on too many opposing indicators.
- Do not stalemate indicators with patterns, rather reinforce to obtain coherent patterns.
- Volume and structure should integrate by first analyzing the price and its actions.
6. The Consequences of Algorithmic Trading and High-Frequency Trading (HFT):
Algorithmic trading and HFT take over modern financial markets. Automated algorithmic trading entails essentially instantaneous trades according to strict preset standards. Such practices are capable of liquidating markets into seconds which change underlying price movements making it impossible to apply even the most basic forms of technical analysis.
The market gets affected in the following ways:
- Designed breakouts to fool less experienced traders.
- Breaking “flash” volume spikes that instantly reverse.
Defies chart patterns – irrational movements.
This is best seen in lower volume times or during the low time frame (1 minute or tick) trading sessions. Algos may perceive strong patterns as just noise on their systems.
Recommended solutions:
- Avoid operating within extremely short time frames unless utilizing a bot.
- Weekly or monthly time frames should also be used as noise is erratic.
If possible, utilize TA together with order flow analysis.
7. Emotional and Psychological Biases in Trading.
Self bias results in patterns that do not exist framed within technical analysis.
Common mistakes:
- Drawing a pattern that favors bias.
- Blindly holding losing trades while expecting an irrational reversal.
Acting on single indicators without analysis.
The algorithm will get destroyed by its own logic with illogical conditions without sufficient controls on high precision setups.
What to do:
- Make sure to backtest your strategy before putting it into a live trading environment.
- Stay focused on your trading plan and practice sound risk management.
- Make a vigilant effort to keep a trading journal to help track and mitigate emotional decision-making.
Conclusion: Understand Where TA is Effective—and Where It Falls Short:
Technical analysis is a widely used form of market analysis that has its strengths, but is not always the most effective tool, and its most effective application requires:
- Active trading in a liquid market with a tendency to trend.
- Strong economic periods.
- Highly self-disciplined and experienced users.
Do not use TA in:
- Markets rife with news events.
- Thinly traded instruments.
- Highly volatile markets characterized by uncertainty.
- Execution without emotion-based reasoning.
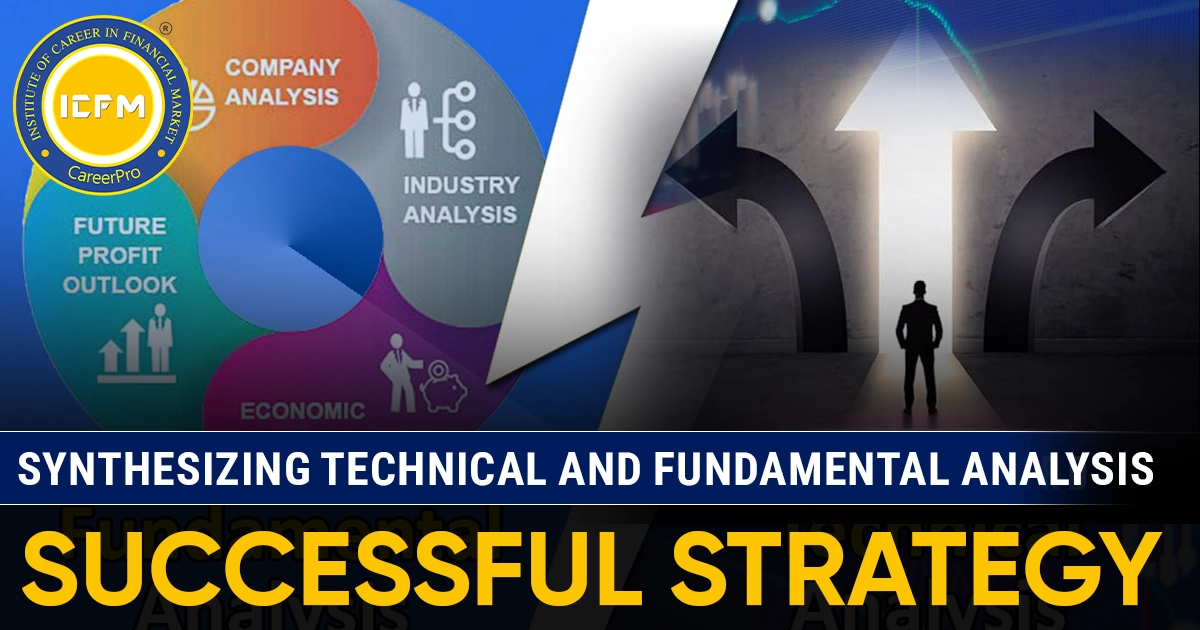
Knowing when not to blindly trust technical analysis is just as crucial as knowing how to use it effectively. Combine it with solid risk management, fundamental knowledge of the markets, and emotional regulation for the best outcome.


