
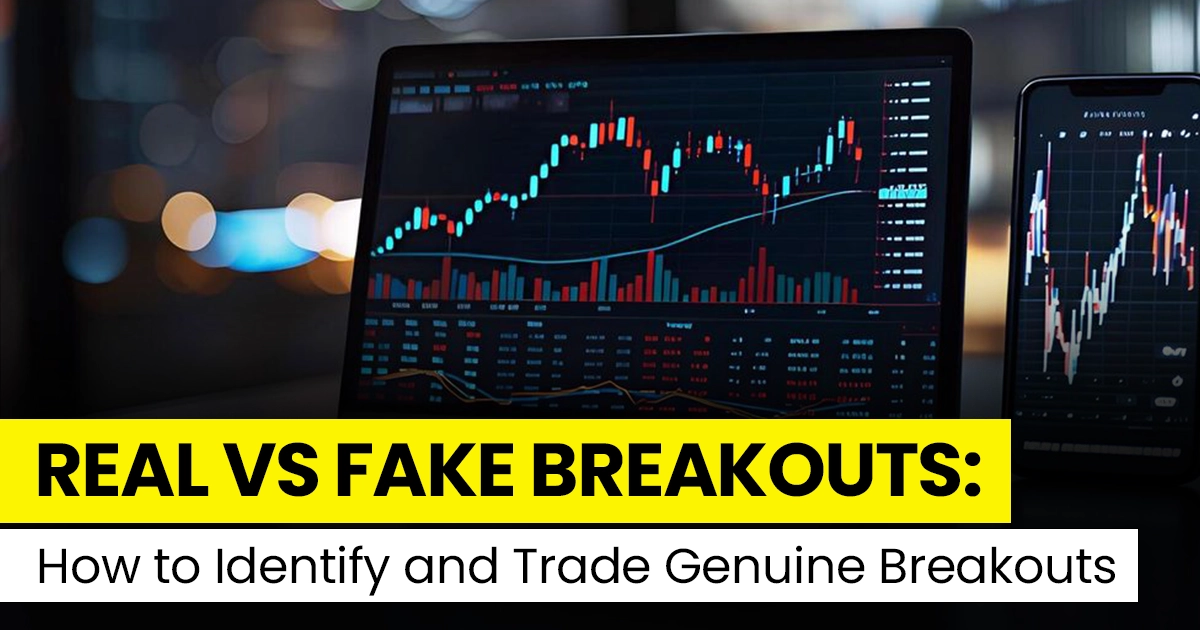
Beginning
The breakout is one of the most tempting and dangerous patterns that technical traders look for. It's a very simple idea: when the price breaks through a major support or resistance level, it means that there is a lot of momentum behind it that will push the price much further in the direction of the break. The entry is clear, the risk is known, and the possible reward is big.
What's the problem? A lot of breakouts don't work. They break through a key level, set off a chain reaction of eager entries, and then quickly turn around, leaving traders stuck in losing positions as the market goes back through the level they thought they had conquered. These are called false breakouts, fakeouts, or bull/bear traps, and they don't happen by chance. In many cases, institutional players create them to make money.
In this blog, we'll go into great detail about how breakout trading works, why false breakouts happen, and how to tell the difference between real breakouts and fakeouts. This way, you can trade with confidence instead of hope.
What does "breakout" mean?
A breakout happens when the price moves past a certain level of support or resistance with enough force to show that it will keep going in the same direction as the break. There are many ways these levels can look:
Horizontal areas of support and resistance
Lines of trend and channel boundaries
Moving averages, especially the 200 SMA
Triangles, rectangles, head and shoulders, and wedges are all types of chart patterns.
Psychological round numbers, like 22,000 on the Nifty and 45,000 on the Sensex
Previous highs or lows in swings
In theory, when the price breaks above resistance, people who were short rush to cover, new buyers come in, and momentum pushes the price higher. If the price breaks below support, the opposite is true. But in real life, things are a lot messier.
What Causes False Breakouts
To avoid false breakouts, you need to know why they happen. There are a number of reasons that are related to each other:
1. Stop-Hunt Operations
Market makers and institutional traders know where retail stop-losses are grouped together. Retail traders often put stops just above resistance for short positions and just below support for long positions. Institutions can push the price through these levels, set off the stops, collect the extra money that comes in, and then change the price back in the right direction. The stops of the retail traders become the entries of the institution.
2. Breakouts with low volume
When the price breaks a key level with low volume, it means that the market isn't sure what to do. Volume is what makes real breakouts happen. A break is likely to fail without it; this just means that fewer people are taking part in the move, and there isn't enough energy to keep it going.
3. Shocks from news and feelings
A piece of news that comes out of nowhere, like a surprise earnings miss, a change in the world of politics, or a statement from a central bank, can temporarily push the price through a key level. When the initial shock wears off and trading starts to make sense again, prices often go back to where they were before. These fakeouts that happen because of events happen a lot when important data is released.
4. Traps in the Market Structure
Markets often make patterns that look like breakouts but are really part of a bigger consolidation. A triangle that looks like it's breaking up could just be moving into the next part of a range. Traders are open to these pattern-level traps if they don't understand how the market as a whole works.
Traits of a Real Breakout
Real breakouts leave a unique fingerprint. One of the most useful skills a technical trader can learn is how to spot it.
1. Confirmation of High Volume
A sudden rise in volume is the best sign that a breakout is real. When the price breaks through resistance with a lot of volume, like 1.5 to 2 times the 20-day average, it shows that people really believe in it. A lot of people in the market agree with the move. This is the exact opposite of a stop-hunt, which is usually done with a lot of accuracy and not too much volume.
2. A Clean Break with Strong Candles
A real breakout makes big, clear candles that close well above the key level, not just a wick. A candle that only wicks through a level and then closes back inside the range is a warning sign. On upside breakouts, look for candles with strong bodies and small upper wicks. On downside breaks, look for candles with large bodies and small lower wicks.
3. Before Consolidation (The Build-Up)
Before the strongest breakouts, there is a period of compression, which is when the price coils like a spring in a tight range. You can often see this as a triangle, wedge, or rectangle of consolidation near an important level. During this phase, the volatility contracts (the ATR goes down and the Bollinger Bands get narrower). When the break finally happens in this kind of setup, it usually happens quickly and for real.
4. A successful retest
A successful retest of the broken level is one of the most reliable signs that something is true. After breaking through resistance, the price drops back down to test that level as new support and stays there. The pullback should have less volume than the breakout. A confirmed retest makes continuation much more likely.
5. In line with the bigger trend
Breakouts that happen in the same direction as the trend on longer timeframes are much more likely to happen than breakouts that go against the trend. A bullish breakout on the daily chart has a much better chance of working than a breakout that goes against the main trend. This is true for stocks or indexes that are in an uptrend on the weekly chart.
What a False Breakout (Fakeout) Looks Like
1. Low or Falling Volume
The most common warning sign of a breakout is low volume. If the market breaks a key level and the volume is below average, be very careful.
2. A Fast Return to the Range
If the price breaks out and then closes back inside the previous range right away or within one to three sessions, it is almost certainly a fakeout. The speed of the reversal is important because real breakouts don't fail that quickly.
3. Breakout at the End of a Long Trend
Fakeouts happen a lot when a trend has been going on for a long time and is well-established. After a long uptrend, a breakout above the last resistance level is often the last gasp of the bulls before institutions start selling. Also, after a long downtrend, a break below support can be the last sign of giving up before the trend changes.
4. Previous move was too long
If the price has already moved a lot without a big pullback, there isn't much energy for a breakout continuation. If the RSI, distance from moving averages, or Bollinger Band width show that conditions are too extreme, a breakout is more likely to fail.
Trading Rule: Don't ever enter a breakout trade just because the price crossed a line. Before putting money on the line, wait for confirmation in the form of volume, a candle body, or a retest.
Breakout trading strategies: when to enter, when to stop, and when to hit your target
Here is a disciplined way to set up real breakout trades:
Buy when the price closes above resistance for the first time (not during the day); sell when it closes below support for the first time.
Stop-Loss: Put it just below the broken support (now resistance) or above the broken resistance (now support).
Target: Find the height of the last pattern or consolidation and draw a line from the breakout point.
Risk-Reward: Before you enter, make sure the risk-reward ratio is at least 1:2.
Tools to Sort Breakouts
Indicators of volume: OBV (On-Balance Volume), VWAP, and Volume MA
Momentum oscillators like RSI and MACD should be in line with the direction of the breakout.
ATR (Average True Range): Check to see if the breakout candle is really important compared to recent volatility.
Breadth indicators: Are other stocks or sectors backing up the move? Breadth proves quality
In conclusion
Breakout trading isn't about jumping at every level breach; it's about being patient, disciplined, and being able to read volume, context, and market structure to tell the difference between the real and the fake. The traders who make the most money from breakouts are not the ones who act the fastest; they are the ones who wait the longest for confirmation.
There will always be false breakouts in the markets. They are a basic part of how institutional money works. But if you have the right filters, the right amount of patience, and the right plan for how to carry out the trade, you can avoid being the liquidity that institutions look for and instead be on the right side of the trade when real momentum comes.
Real vs Fake Breakouts: How to Identify and Trade Genuine Breakouts | TradeSmart

Comments
Related posts
In the stock market, identifying the right trend at the right time can make a huge difference in trading success. ....

Learn about the TEMA Indicator (Triple Exponential Moving Average), including its formula, advantages, strategies, settings, and how traders use it ....
In trading, one of the most persistent challenges is identifying the direction of the market and staying aligned with it. ....
In the fast-moving world of financial markets, traders constantly search for tools that can bring clarity to price action. One ....

In the vast world of financial markets, few debates are as enduring as the one between technical analysis and other ....
