
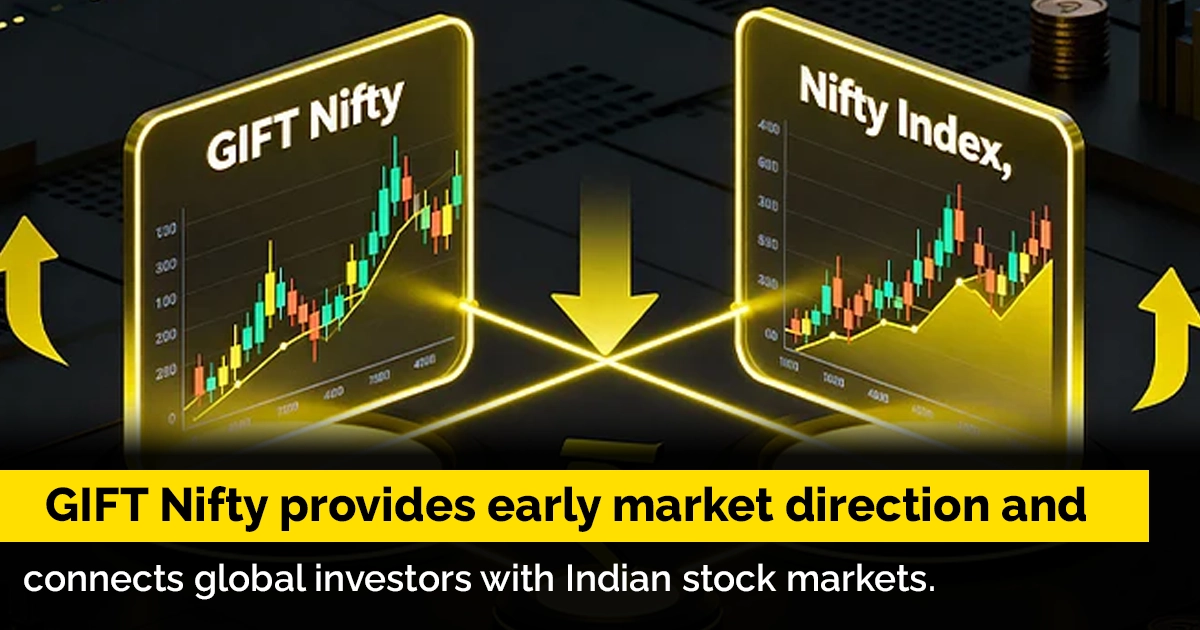
Learn how GIFT Nifty works, its trading mechanism, impact on Indian stock markets, benefits, global influence, and why traders closely ....
Learn how GIFT Nifty works, its trading mechanism, impact on Indian stock markets, benefits, global influence, and why traders closely ....
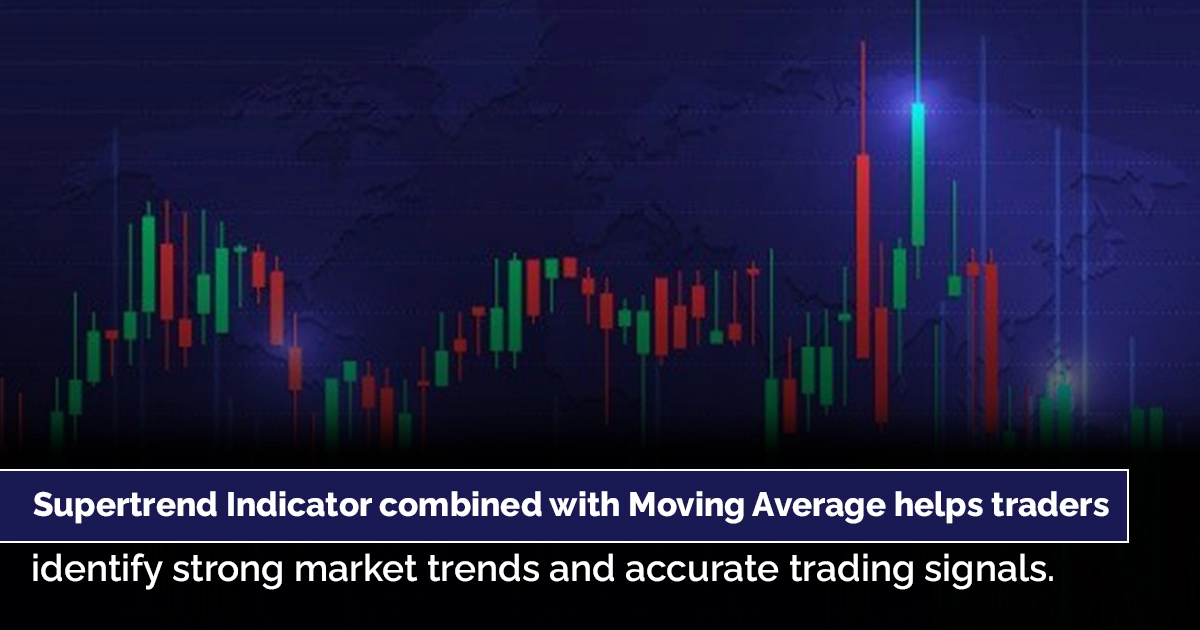
Learn how the Supertrend Indicator with Moving Average works in trading. Understand strategies, settings, advantages, formulas, and trend-following techniques for ....
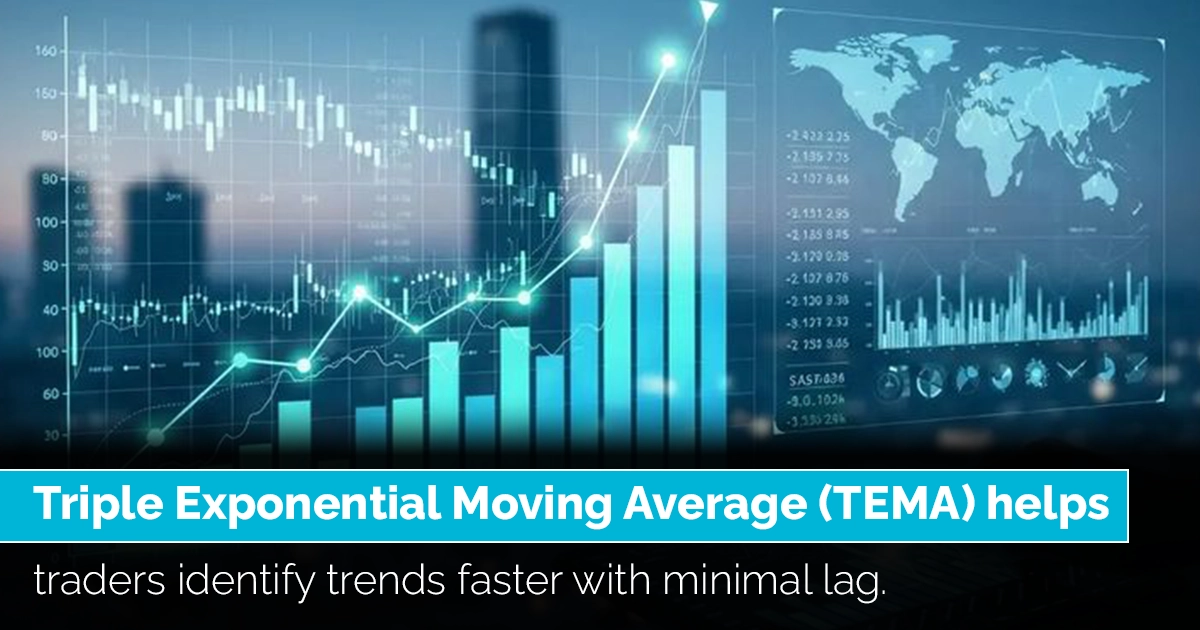
Learn about the TEMA Indicator (Triple Exponential Moving Average), including its formula, advantages, strategies, settings, and how traders use it ....
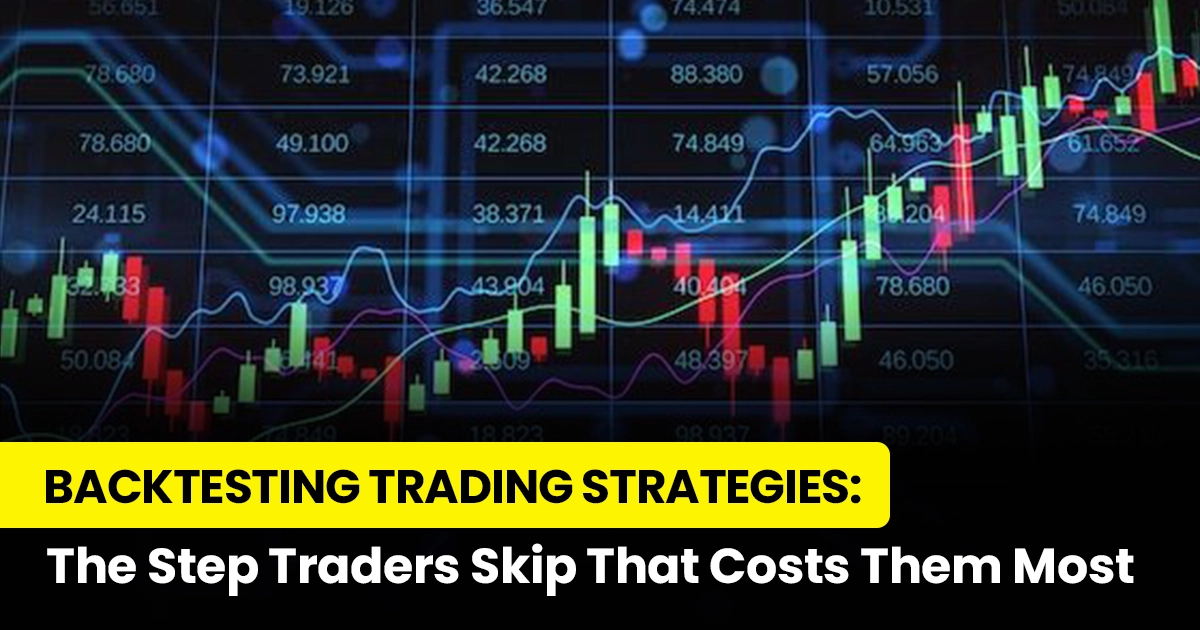
Backtesting is the one step most retail traders skip — and the one that separates consistently profitable traders from the ....
Stop getting trapped in false breakouts. Learn how to distinguish genuine breakouts from fakeouts using volume confirmation, candle structure, retest ....
Confused between weekly and monthly options expiry? Discover the key differences in theta decay, gamma risk, premium cost, and ideal ....
Learn what Open Interest is, how to read OI data with price and volume, and how to use it to ....
Understand Order Flow trading and how traders use real-time data like bid-ask, volume, and liquidity to identify market direction and ....
Understand Fair Value Gap (FVG), a powerful smart money concept used to identify price imbalances and high-probability trade setups in ....
Understand how Volume Profile works and how traders use POC, Value Area, and volume distribution to identify strong support and ....
