
In today's trading world, knowing where the market has traded the most is much more useful than just knowing how prices have changed. This is when the Volume Profile indicator comes in handy.
Volume Profile is different from other indicators because it shows you how much volume was traded at certain price levels. This helps traders find strong support, resistance, and fair value zones. If you want to trade on the same day or over a longer period of time, learning how to use Volume Profile can give you a big advantage in the market.
What is the Volume Profile?
Volume Profile is a complex technical analysis tool that shows how much trading has happened at certain price levels over a certain amount of time.
It makes a horizontal histogram by putting volume on the price axis instead of the bottom, like regular volume bars do.
In short:
It tells you where the big players are making trades.
It shows key price points
It helps find areas of fair and unfair value.
Important Parts of Volume Profile
To get the most out of Volume Profile, you need to know what its main parts are:
1. Point of Control (POC)
The price point where the most trades happened
Works like a strong magnet for price
Thought to be the best price of the day
2. Area of Value (VA)
This is the range where about 70% of all trades take place.
It is made up of:
VAH (Value Area High) → Top limit
VAL (Value Area Low) → Lower boundary This area is where the market finds a balance.
3. Nodes with a lot of traffic (HVN)
Places where a lot of trading happens
Strong areas of support and resistance
4. Nodes with Low Volume (LVN)
Places where there isn't much trading
Price changes quickly in these areas.
Why the Volume Profile is Important
Professional and institutional traders use Volume Profile a lot because
1. Finds strong support and resistance
These levels are based on real trading volume, unlike regular lines.
2. Shows how the market is set up
It helps you figure out if the market is:
Balanced, trending, and reversing
3. Makes Trade More Accurate
Traders can make more accurate entries by focusing on high-volume zones.
Different kinds of volume profiles
1. Volume Profile with a Fixed Range
Used on a specific price range
Good for looking at certain moves
2. Profile of the Session Volume
Used for trading during the day
Starts over every trading session
3. Profile of the Volume in the Visible Range
Changes automatically to fit the visible chart area
How to Use Volume Profile When Trading
Let's learn about real-life strategies that traders use:
1. The POC Bounce Plan
The Point of Control is like a strong support or resistance.
Buy Setup:
Price comes down to POC from above
Holds and shows a bullish reversal
Enter long Sell Setup:
Price moves up to POC from below
Shows that it was rejected
Type in short This works best when the market is moving sideways.
2. Trading Strategy for the Value Area
Markets tend to move around in the value area.
In the Value Area:
Buy close to VAL
Sell close to VAH
Outside of the Value Area:
Bullish if it breaks above VAH
Breakdown below VAL means bearish.
3. Breakout from the Value Area
When the price breaks out of the value area with a lot of volume, it usually means that a trend is starting.
For example:
Price stays steady inside VA
Breaks above VAH
There is a lot of momentum after
4. Strategy for LVN Breakout
Low Volume Nodes show places where there isn't much interest.
Price moves quickly through LVNs.
Great for trades with momentum This is what traders use to make quick moves during the day.
Volume Profile compared to regular volume
Feature: Volume ProfileVolume Displays Volume in a Traditional WayIn terms of price and time
Accuracy: High, Moderate
Key Levels: Yes or No
Best for: Advanced Trading and Basic Analysis
Volume Profile gives you more information than regular volume indicators.
Benefits of Volume Profile
Finds real support and resistance
Helps you understand what institutions do
Makes timing for entering and leaving better
Works in all types of markets, like stocks, futures, and forex.
Good for both day trading and swing trading
Volume Profile's Limitations
A little hard for beginners
Needs to practise to understand correctly
Works best when the price action confirms it
Can give wrong signals in markets with low volume
Volume Profile: Expert Tips
Work with Price Action
Always check with candlestick patterns.
Pay attention to POC and Value Area
These are the most important levels.
Don't Overload Charts
Make sure your setup is clean and easy to use.
Use with Trend Analysis
Make sure trades are in line with the overall market direction.
Example from the Real Market (Conceptual)
A stock is trading between ₹500 and ₹520.
POC is at 510.
The price of VAH is ₹520.
VAL costs ₹500.
Scenario 1:
Price moves close to ₹500 (VAL) and then reverses in a bullish way, which is a good time to buy.
Case 2:
Price breaks above ₹520 (VAH) with a lot of volume, so it's time to trade.
Scenario 3:
Price moves quickly through the ₹505–₹507 → LVN zone → Momentum move
Who Should Use Volume Profile?
Volume Profile is great for:
Traders who trade during the day
Traders who swing
Traders who are professionals
Traders who deal in options
Traders who use algorithms
Conclusion
Volume Profile is one of the best tools for trading today. It goes beyond price and helps you figure out where the real action is in the market.
Traders can make better choices, avoid false breakouts, and improve their overall accuracy by concentrating on POC, Value Area, and volume distribution.
But it shouldn't be used alone, like any other trading tool. For the best results, use it with price action, trend analysis, and good risk management.
Last thought:
"Price tells you what's going on, but volume tells you why."
You will start to see the market in a whole new way if you start using Volume Profile on your charts and practise it often.

Comments
Related posts
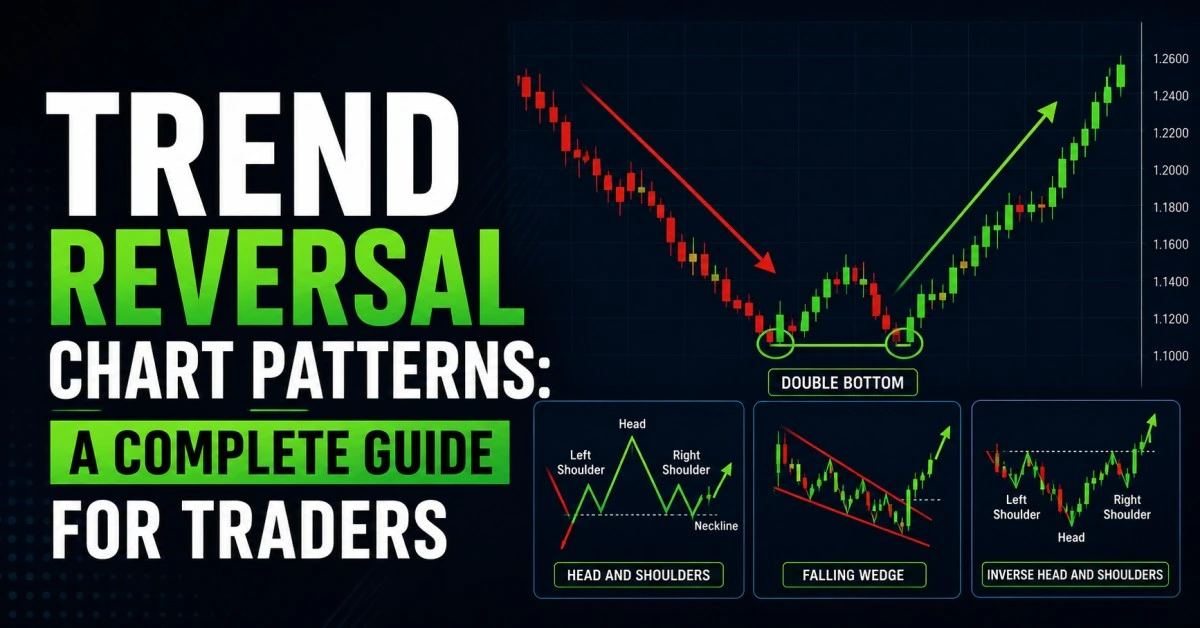
In the stock market, identifying the right trend at the right time can make a huge difference in trading success. ....
Learn about the TEMA Indicator (Triple Exponential Moving Average), including its formula, advantages, strategies, settings, and how traders use it ....
In trading, one of the most persistent challenges is identifying the direction of the market and staying aligned with it. ....
In the fast-moving world of financial markets, traders constantly search for tools that can bring clarity to price action. One ....
In the vast world of financial markets, few debates are as enduring as the one between technical analysis and other ....
