What Happened in the Markets Today? (June 11, 2026)
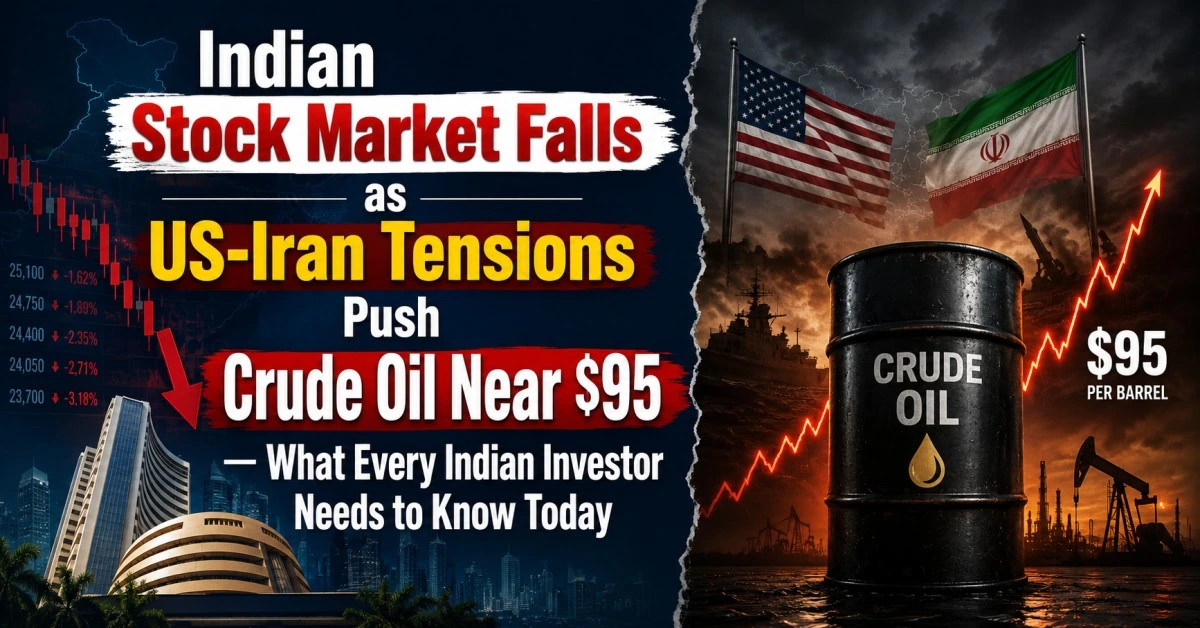
If you checked your portfolio this morning and felt uneasy — you are not alone. The BSE Sensex dropped 358 points to 73,624 and the NSE Nifty slipped 117 points to 23,098 in early trade on June 11, 2026. That fall did not come from any domestic earnings miss or RBI policy surprise. It came from a battlefield 4,000 kilometres away — the Persian Gulf.
For the second consecutive day, US forces launched military strikes on Iranian targets. Tehran retaliated by targeting American military installations in Bahrain, Jordan, and Kuwait. The Strait of Hormuz — the narrow channel through which nearly 20 percent of all global oil shipments pass — remained virtually shut. Within hours, Brent crude climbed to $94.68 per barrel, close to the $95 mark, and the ripple hit every index that depends on cheap energy imports. India imports over 85 percent of its crude oil requirement. It was never going to be insulated from this.
Why Does a War in the Middle East Hit Your Portfolio in Delhi?
This is the question most Indian retail investors ask when geopolitical news lands. The connection feels abstract, but the chain reaction is mechanical and fast.
India imports over 85 percent of its crude oil. When Brent moves from $80 to $95, India's monthly oil import bill can rise by several billion dollars almost overnight. That surge flows through the entire economy — it raises diesel costs for logistics companies, increases raw material costs for manufacturers, widens the current account deficit (CAD), pressures the rupee, and forces the government to either absorb the hit through subsidies or pass it on through fuel price hikes.
May 2026 gave us a live preview of this. The government announced successive retail fuel price hikes after Brent stayed above $100 for most of that month. Sensex and Nifty fell 2.8 percent and 1.9 percent respectively during May alone. What is playing out today is a continuation of that pressure — not an isolated incident. Click Now
How Crude Oil Drains Indian Markets — The Four-Step Chain
1. Oil import bill rises sharply → Current Account Deficit (CAD) widens
2. Wider CAD pressures the rupee → INR weakens against the US dollar
3. FIIs withdraw from Indian equities to protect dollar-denominated returns
4. FII outflows amplify selling → Sensex and Nifty slide further
This self-reinforcing loop is why a conflict that began overseas ends up showing on your Demat statement. Today's combination of US-Iran military action, near-total Strait of Hormuz disruption, rising crude, persistent FII selling, and elevated US inflation created almost a perfect storm of negative sentiment for Indian equities.
Which Indian Sectors Get Hit Hardest — and Which Are Insulated?
Not every sector reacts the same way to an oil price spike. Understanding which sectors are exposed and which benefit helps investors make precise decisions rather than panic-selling everything indiscriminately.
Today's market data confirmed this analysis precisely. HCL Tech, Infosys, Tech Mahindra, and TCS led the decline — partly because rupee depreciation raises their cost base and partly because global risk-off selling hits large liquid stocks first. ICICI Bank, Power Grid, Bharti Airtel, and IndiGo provided relative support. Investors who understand sectoral sensitivity were not surprised by this pattern; they anticipated it.
Opinion: Is This a Buying Opportunity or Is More Pain Coming?
ICFM's research desk has tracked five major crude-driven market selloffs over the past decade. Our view: the current scenario is painful but historically it resolves in one of two ways, and both have well-defined technical triggers that traders can watch.
Scenario A — De-escalation: If the US-Iran conflict moves toward ceasefire or diplomatic engagement, Brent crude typically drops 8 to 15 percent within two to three sessions. Nifty would likely recover 200 to 400 points relatively quickly. That is the scenario where disciplined investors look for quality large-caps at a discount.
Scenario B — Prolonged conflict: If the Strait of Hormuz remains near-fully closed for more than 30 days — as it was threatening to do in April and May 2026 — Brent could push past $105 again. In that case, expect Nifty to retest the 22,500 to 22,800 zone and Sensex to potentially dip below 72,000. That is not the base case, but it must be priced into position sizing today.
Enrol Today → Certified Technical Analys
How to Technically Read the Nifty During a Geopolitical Selloff
Technical analysis cannot predict wars. But it tells you exactly where the market is likely to find buyers — and where it will find more sellers. In a crude-driven panic, three tools matter most.
1. Support and Resistance Levels
Based on the current Nifty chart structure, the immediate support zone sits between 22,900 and 23,000. The 200-day moving average — a key institutional reference point — is near this zone. If Nifty closes below 22,800 on two consecutive sessions, the next meaningful support is around 22,300 to 22,500, which also held during the heavy March 2026 selloff. Knowing these levels in advance means you are not reacting; you are observing a known map.
2. RSI Divergence — The Most Underused Signal in Volatile Markets
When the Nifty makes a lower price low but the RSI makes a higher low on the daily chart, it signals weakening selling momentum. This pattern is called positive divergence. It appeared in late March 2026 just before the 700-point recovery. In a crude-driven selloff, watch the daily RSI carefully. A reading below 40 combined with divergence from price often marks the turning point — before the fundamental news visibly improves.
3. Options PCR and Implied Volatility
During geopolitical panic, traders rush to buy puts for protection, which sharply drops the put-call ratio (PCR) and spikes implied volatility (IV). When Nifty's PCR falls below 0.70, the market is statistically oversold in sentiment terms. Historically, recovery begins within three to five trading sessions of such extreme readings. This is where experienced F&O traders find asymmetric setups — not by predicting the war's outcome, but by reading the market's fear levels.
What Should Indian Retail Investors Do Right Now?
This is the most important question — and the most abused one on social media, where every market move generates contradictory noise. Here is a structured, category-wise framework based on investor profile.
Click NowIf You Are a Long-Term Equity Investor (3-Year+ Horizon)
Do nothing impulsive. Geopolitical selloffs in India have historically reversed within 30 to 90 days if the conflict does not cause a global recession. Continue your SIPs without interruption. A 5 to 8 percent correction in quality large-cap names creates a dollar-cost-averaging opportunity, not a panic exit signal. The investor who stopped their SIP during the March 2026 drop lost the recovery upside that came in April and May.
If You Are a Short-Term Swing Trader
Wait for confirmation of support — do not attempt to catch a falling knife in the first two sessions of a geopolitical shock. Watch the 23,000 zone on Nifty. If it holds for two consecutive sessions with declining volume on down days, that is your confirmation signal. Define your stop-loss before entering the trade, not after. Position sizing matters more than entry timing in volatile environments.
If You Are an Active F&O Trader
Implied volatility rises sharply during geopolitical events, inflating option premiums significantly. Buying options in a high-IV environment is expensive and frequently a losing trade. Experienced traders tend to look at option-selling strategies or defined-risk spreads once the initial panic phase subsides and IV starts declining. This requires technical skill, real-time chart reading ability, and strict risk management — not guesswork.
Frequently Asked Questions (FAQs)
Why did the Indian stock market fall on June 11, 2026?
Sensex and Nifty fell because escalating US-Iran military tensions pushed Brent crude close to $95 per barrel. India imports over 85 percent of its crude oil, so higher oil prices directly threaten inflation, corporate margins, the rupee, and the current account deficit. Persistent foreign fund outflows and elevated US inflation data added further pressure on investor sentiment.
How does crude oil price directly affect the Sensex and Nifty?
High crude oil prices widen India's current account deficit, weaken the Indian rupee, and increase operating costs for companies across aviation, chemicals, paints, logistics, and FMCG sectors. This reduces earnings expectations across a broad range of index constituents, triggering selling. Foreign investors also tend to pull capital out of oil-importing economies when crude spikes sharply, adding to downward pressure.
Which Indian sectors benefit when crude oil prices rise?
Oil and gas production companies like ONGC and Oil India benefit most directly — their crude oil sales revenue rises with global benchmarks. Renewable energy companies that depend less on fossil fuel feedstocks also tend to hold up relatively well. However, the overall net impact on India's equity market remains negative during sharp crude price spikes because the import cost pressure outweighs the benefit to upstream producers.
Will the Sensex and Nifty recover after this fall?
Historical data suggests that geopolitical selloffs triggered by crude oil spikes recover once the conflict shows de-escalation signals. In January 2020, Nifty recovered the Soleimani-shock losses within 15 sessions. In April 2026, the index bounced 700 points within six sessions after a ceasefire signal emerged. If the Strait of Hormuz closure persists and crude sustains above $105, however, a deeper correction toward 22,300 on Nifty cannot be ruled out. The recovery timeline depends entirely on the conflict's duration.
Why did Indian IT stocks fall today even though they do not use crude oil?
IT stocks like TCS, Infosys, HCL Tech, and Tech Mahindra fell for two indirect reasons. First, rupee depreciation — triggered by India's widening oil import bill — raises their employee cost base when measured in dollar terms, pressuring margins. Second, during global risk-off events, large-cap liquid stocks are the first to be sold by institutional investors who need to raise cash quickly. IT stocks are among the most liquid in the Nifty, making them early targets in any sentiment-driven selloff.
How can I learn to navigate markets like this with confidence?
Technical analysis equips investors and traders with chart-reading skills to identify support levels, trend signals, momentum indicators, and divergence patterns — all critical during geopolitical volatility. ICFM India's Certified Technical Analyst course in Laxmi Nagar, New Delhi, covers all of these tools with live market application. Thousands of students across Delhi-NCR have used these skills to make more informed, process-driven trading and investment decisions. Visit icfmindia.com for batch timings and fees.
The Bottom Line: Knowledge Is Your Best Hedge
Wars end. Ceasefire talks begin. Crude retreats. Markets recover. This pattern has played out in 2020, in 2022, and across multiple episodes in 2026 already. The investors who navigated those recoveries profitably were not the ones who predicted when the war would end. They were the ones who understood their charts, managed their risk size, and made decisions based on process rather than panic.
Today's fall is a lesson in how interconnected the global economy has become. A military strike near the Strait of Hormuz moves your portfolio in Delhi within hours. That reality is not changing. What you can control is how prepared you are to read it, respond to it, and eventually position for the recovery when it comes — as it always has.